In March, we announced SpacetimeDB 2.0 alongside a benchmark that claimed SpacetimeDB could process over 100,000 end-to-end transfer transactions per second. The video and our posts on social media picked up a lot of attention, and in some cases drew criticism for what some felt was misleading benchmarking, especially from competitors whose products did not perform well in our testing.
Recently, we discovered and fixed several issues in SpacetimeDB, which unfortunately do make the benchmark numbers we published at that time misleading, and for that we apologize. Thing is, they're just not misleading in the way you might expect. The problem wasn't with the benchmark, but with SpacetimeDB itself. It wasn't living up to its true potential.
In particular, after we improved our V8 threading model, SpacetimeDB is now able to process 303,920 ± 4,712 transactions per second in our TypeScript benchmark. That’s an improvement of almost 200% over our original benchmark numbers, which hovered at around 100,000 transactions per second. Because we focused primarily on V8 performance, TypeScript is now actually faster than Rust, which measures only 265,541 ± 940 transactions per second in our benchmark.
Naturally, we’ve updated the graphs on our homepage accordingly!
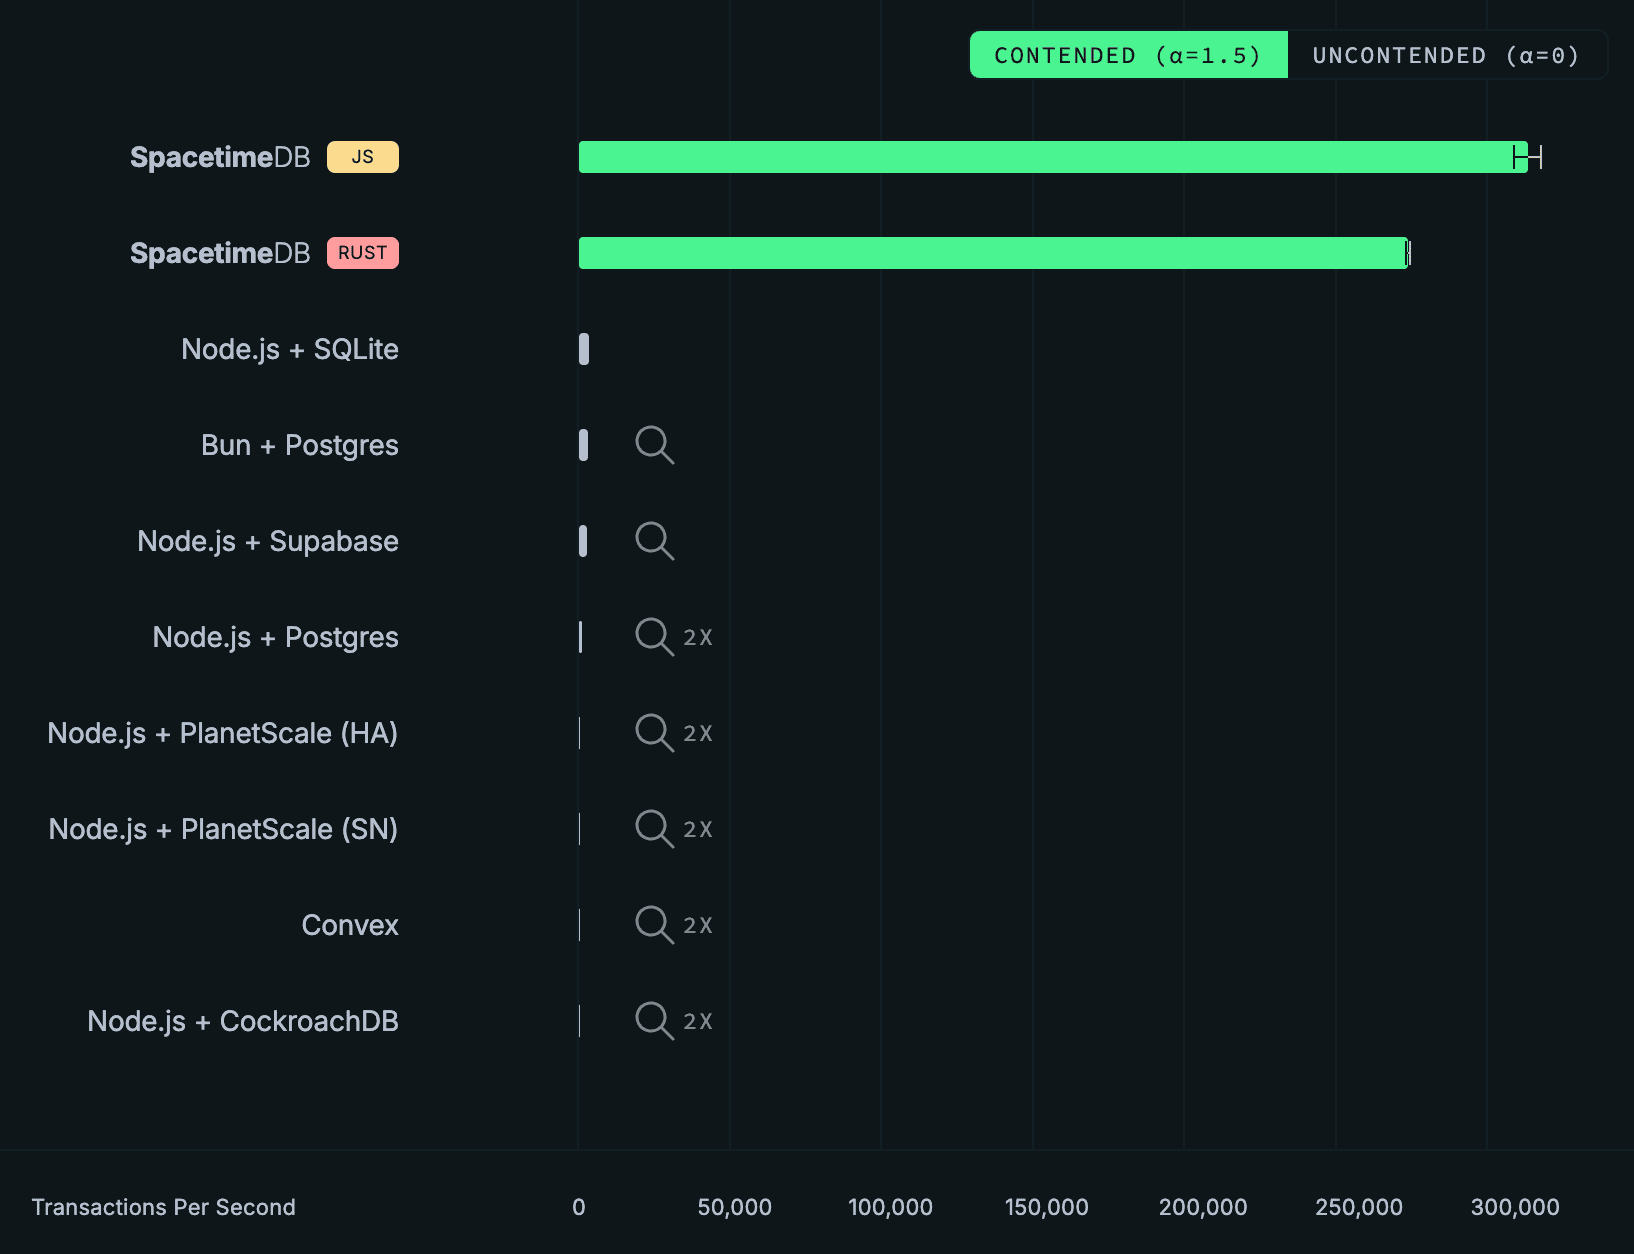
We’ve even added error bars! We would have added error bars for the competitor backends as well, but we're not working with enough pixels. In fact, we had trouble getting the overall throughput for Convex, PlanetScale, and CockroachDB to show up at all on 1080p screens, so today we’re introducing a new feature…
2x Zoom!
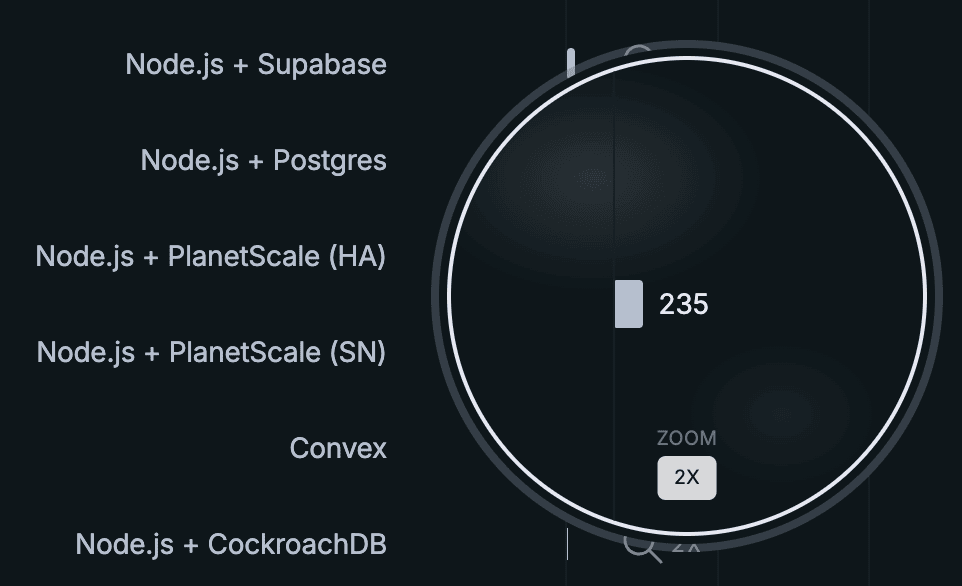
We want to ensure that our benchmarking results are accessible for all users no matter the resolution of their screens.
Why wait so long?
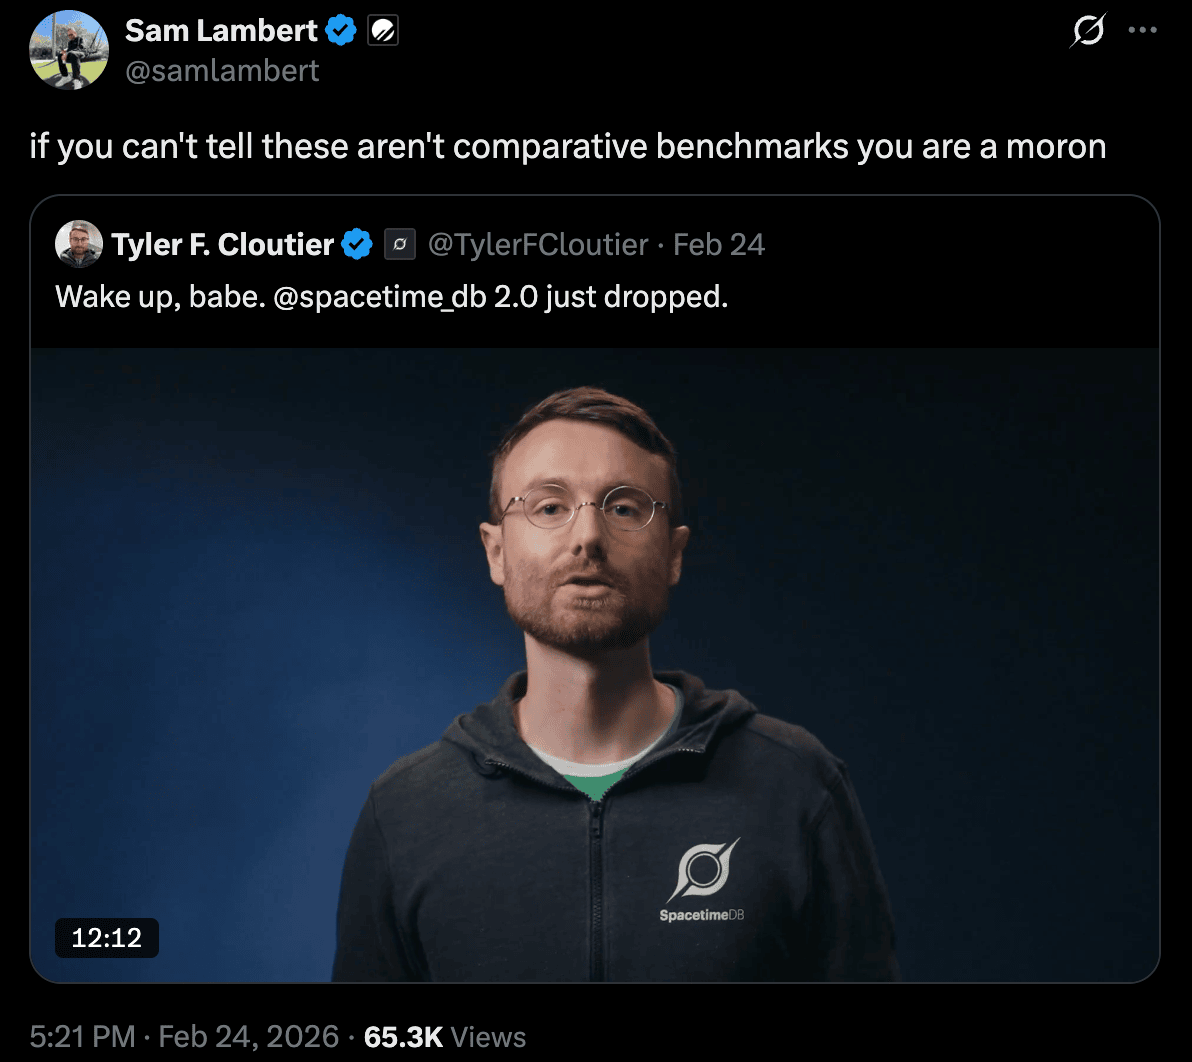
Now, I like some good Twitter banter as much as the next guy, but since we announced 2.0, the team and I have been called “goons”, “liars”, “morons”, “dishonest”, “deceptive” and that our database is “just Redis”, “doesn’t offer replication”, “doesn’t provide ACID guarantees”, that our benchmark was not “comparative” or “apples-to-apples”, and that SpacetimeDB is “not a very good database”. All of which is untrue, of course. Much of this came from PlanetScale, a company who claims to pride themselves on “technical diligence”. However, they did effectively no diligence at all before making broad, sweeping, and incorrect technical claims about our product. Not a great look if you ask me.

We haven’t addressed all of that in a single place, yet. In fact, we’ve been largely silent since releasing our original video.
In the spirit of “technical diligence,” we wanted to take the last several weeks to carefully address the criticism raised about our benchmarking. So let’s finally separate the truth from the lies, explore why we chose this benchmark, why we believe it is an important benchmark, and why SpacetimeDB performs so well on this benchmark (spoiler: contrary to popular assumption it has nothing to do with it being an “in-memory” database).
Let’s start by understanding the benchmark and the criticism.
What is SpacetimeDB?
If you’re not familiar with SpacetimeDB, it is a backend framework that runs your server logic in the same process as the database. The core idea is to combine the server and database into a single integrated system. Not only does this dramatically simplify your code, it also dramatically improves performance. It’s also a very old idea: stored procedures. The difference between SpacetimeDB stored procedures and Postgres stored procedures, for example, is all about usability and user experience. SpacetimeDB lifts stored procedures to be a first-class feature of the database. You upload all of your server logic as a single module which defines your schema, functions, and types. As the app developer, you write in whatever general purpose programming language you like and we use Wasm and JS to run it inside the database.
The Benchmarks

In our benchmark, featured prominently in the 2.0 announcement video, we imagine a simplified banking or accounting application wherein users can make balance transfers between accounts. The benchmark measures transfer throughput, or the number of transfer transactions a given backend stack can process per second. The throughput is measured according to application clients by measuring the number of successful transfer transactions within a window. It is also a full end-to-end benchmark, meaning that we are measuring the performance of the full backend stack including both web server and database together. SpacetimeDB and Convex both combine the server and database into a single platform. For other stacks, we specify both the backend runtime and the database management system.
For reference, here is the SpacetimeDB implementation of the server-side transfer endpoint presented in its entirety:
export const transfer = spacetimedb.reducer(
    { from: t.u32(), to: t.u32(), amount: t.i64() },
    (ctx, { from, to, amount }) => {
        if (from === to) throw new SenderError('same_account');
        if (amount <= 0) throw new SenderError('non_positive_amount');

        const fromRow = ctx.db.accounts.id.find(from);
        const toRow = ctx.db.accounts.id.find(to);
        if (fromRow === null || toRow === null) throw new SenderError('account_missing');
        if (fromRow.balance < amount) throw new SenderError('insufficient_funds');

        ctx.db.accounts.id.update({
            id: from,
            balance: fromRow.balance - amount,
        });

        ctx.db.accounts.id.update({
            id: to,
            balance: toRow.balance + amount,
        });
    }
);
In order to represent a real-world workload, we choose which accounts to include in transfers based on a power-law. This means that some accounts will do more transfers than others, with a small percentage of the accounts doing most of the transfers. Ethereum’s account transfers are found to follow this exact law. Social networks like X also follow this activity distribution.
Methodology
We feel the methodology that PlanetScale recommends in their recent On Benchmarking blog post generally outlines good benchmarking practice.
While we stand by our original benchmark and methodology, for this more in-depth blog post, we reran the same transfer benchmark for SpacetimeDB and all of our competitors to capture and report both throughput and latency data over a 5 minute period of time, with a 30 second warmup period during which throughput and latency measurements are disregarded. All time-series charts show the measurement-window start as a vertical marker.
For Postgres deployments, we configured the Drizzle max connection pool size to be 2x the number of CPU cores on the database machine, in keeping with Postgres best practice. Additionally, we used the default configuration values set by Postgres or, in the case of CockroachDB and PlanetScale, set by the platform. For the Postgres tests, we connected the server directly to Postgres without using PGBouncer (see below).
For Convex, we used default configuration settings. We tested both a cloud deployment on the Pro tier and a self-host deployment with similar results. We are publishing only self-hosted results so that others can easily reproduce the results.
For SQLite, we used the default configuration settings.
For CockroachDB, we configured a cluster of 5 nodes all within the same region and availability zone. We used the default configuration settings. Notably, for CockroachDB max_connections is configured to be unlimited by default. On the server, we configured max connection pool size to be the total number of cores on all machines in the cluster.
For Bun, Node.js, and Drizzle, we used all default configuration settings, except for the max connection pool size as described above.
For all tests, we ran N clients where N is 2x the number of CPUs on the database machine used for the test. We chose this number to ensure optimal throughput for Postgres deployments because the number of connections determines the maximum parallelism for Postgres queries and the max connection pool size is also 2x the number of CPU cores. Notably, PGBouncer is not required because the number of clients is equal to the number of connections. PGBouncer cannot increase the throughput or parallelism of Postgres queries, but it could adversely impact the latency so it was intentionally omitted.
Clients make individual requests to the backend as they would in a real-world workload. They do not batch requests. For SpacetimeDB ONLY, we allowed clients to submit up to 40 requests to the server without waiting for a response. The purpose of this is to simulate a larger number of clients (specifically 2,560 clients) than can easily be run on a single machine so the results are easy to reproduce. If you think this is unfair, I would direct you to Claim 9 (spoiler: we also tested this with the competition and they just can't keep up).
Below is a summary of the configuration settings for each backend.
| Backend | Clients | Pipelining | Drizzle pool | DB max_connections | DB worker procs |
|---|---|---|---|---|---|
| SpacetimeDB | 64 | 40 | N/A | N/A | N/A |
| Node.js + SQLite | 64 | off | N/A | N/A | N/A |
| Node.js + Supabase | 64 | off | 64 | 100 | 8 |
| Bun + Postgres | 64 | off | 64 | 100 | 8 |
| Node.js + Postgres | 64 | off | 64 | 100 | 8 |
| Node.js + PlanetScale (SN) | 64 | off | 64 | 600 | 25 |
| Node.js + PlanetScale (HA) | 384 | off | 384 | 600 | 155 |
| Convex | 64 | off | N/A | N/A | N/A |
| Node.js + CockroachDB (5 node) | 320 | off | 320 | unlimited | N/A |
For the full details, see the benchmark README and code.
Note
Although SpacetimeDB supports replication (see Claim 7), all SpacetimeDB numbers in this post were measured on a single-node deployment of SpacetimeDB Standalone (the version available on GitHub), not the replicated SpacetimeDB Cloud variant. This makes the comparison apples-to-apples with the other single-node databases and lets anyone reproduce the results from publicly available software.
The numbers, in detail
We report two workloads:
- α=1.5 (contended): account selection follows a power-law, so a small set of "hot" accounts collide frequently. This matches what real activity distributions look like (Ethereum transfers, social-graph activity). These are the results that we reported in our keynote presentation, and the results we feel most represent what you're likely to encounter in backends for complex applications.
- α=0 (uncontended): account selection is uniform, so transfers very rarely conflict. We include these results in this report to show that parallelism on low contention workloads cannot save the competition from poor performance.
Here are all of the competitor backends overlaid on the same chart, first contended and then uncontended. Throughput is a linear scale; latency is on a log scale so backends that span four orders of magnitude can share an axis.
Note
The benchmark code (every backend, every workload, all the connector configs) lives at github.com/clockworklabs/SpacetimeDB/tree/master/templates/keynote-2. Every number in this post is reproducible from there with:
pnpm run bench test-1 --seconds 300 --connectors <backend>. If you have an Intel 14900K you can even run it on the same CPU.
Take a look at the throughput graph.
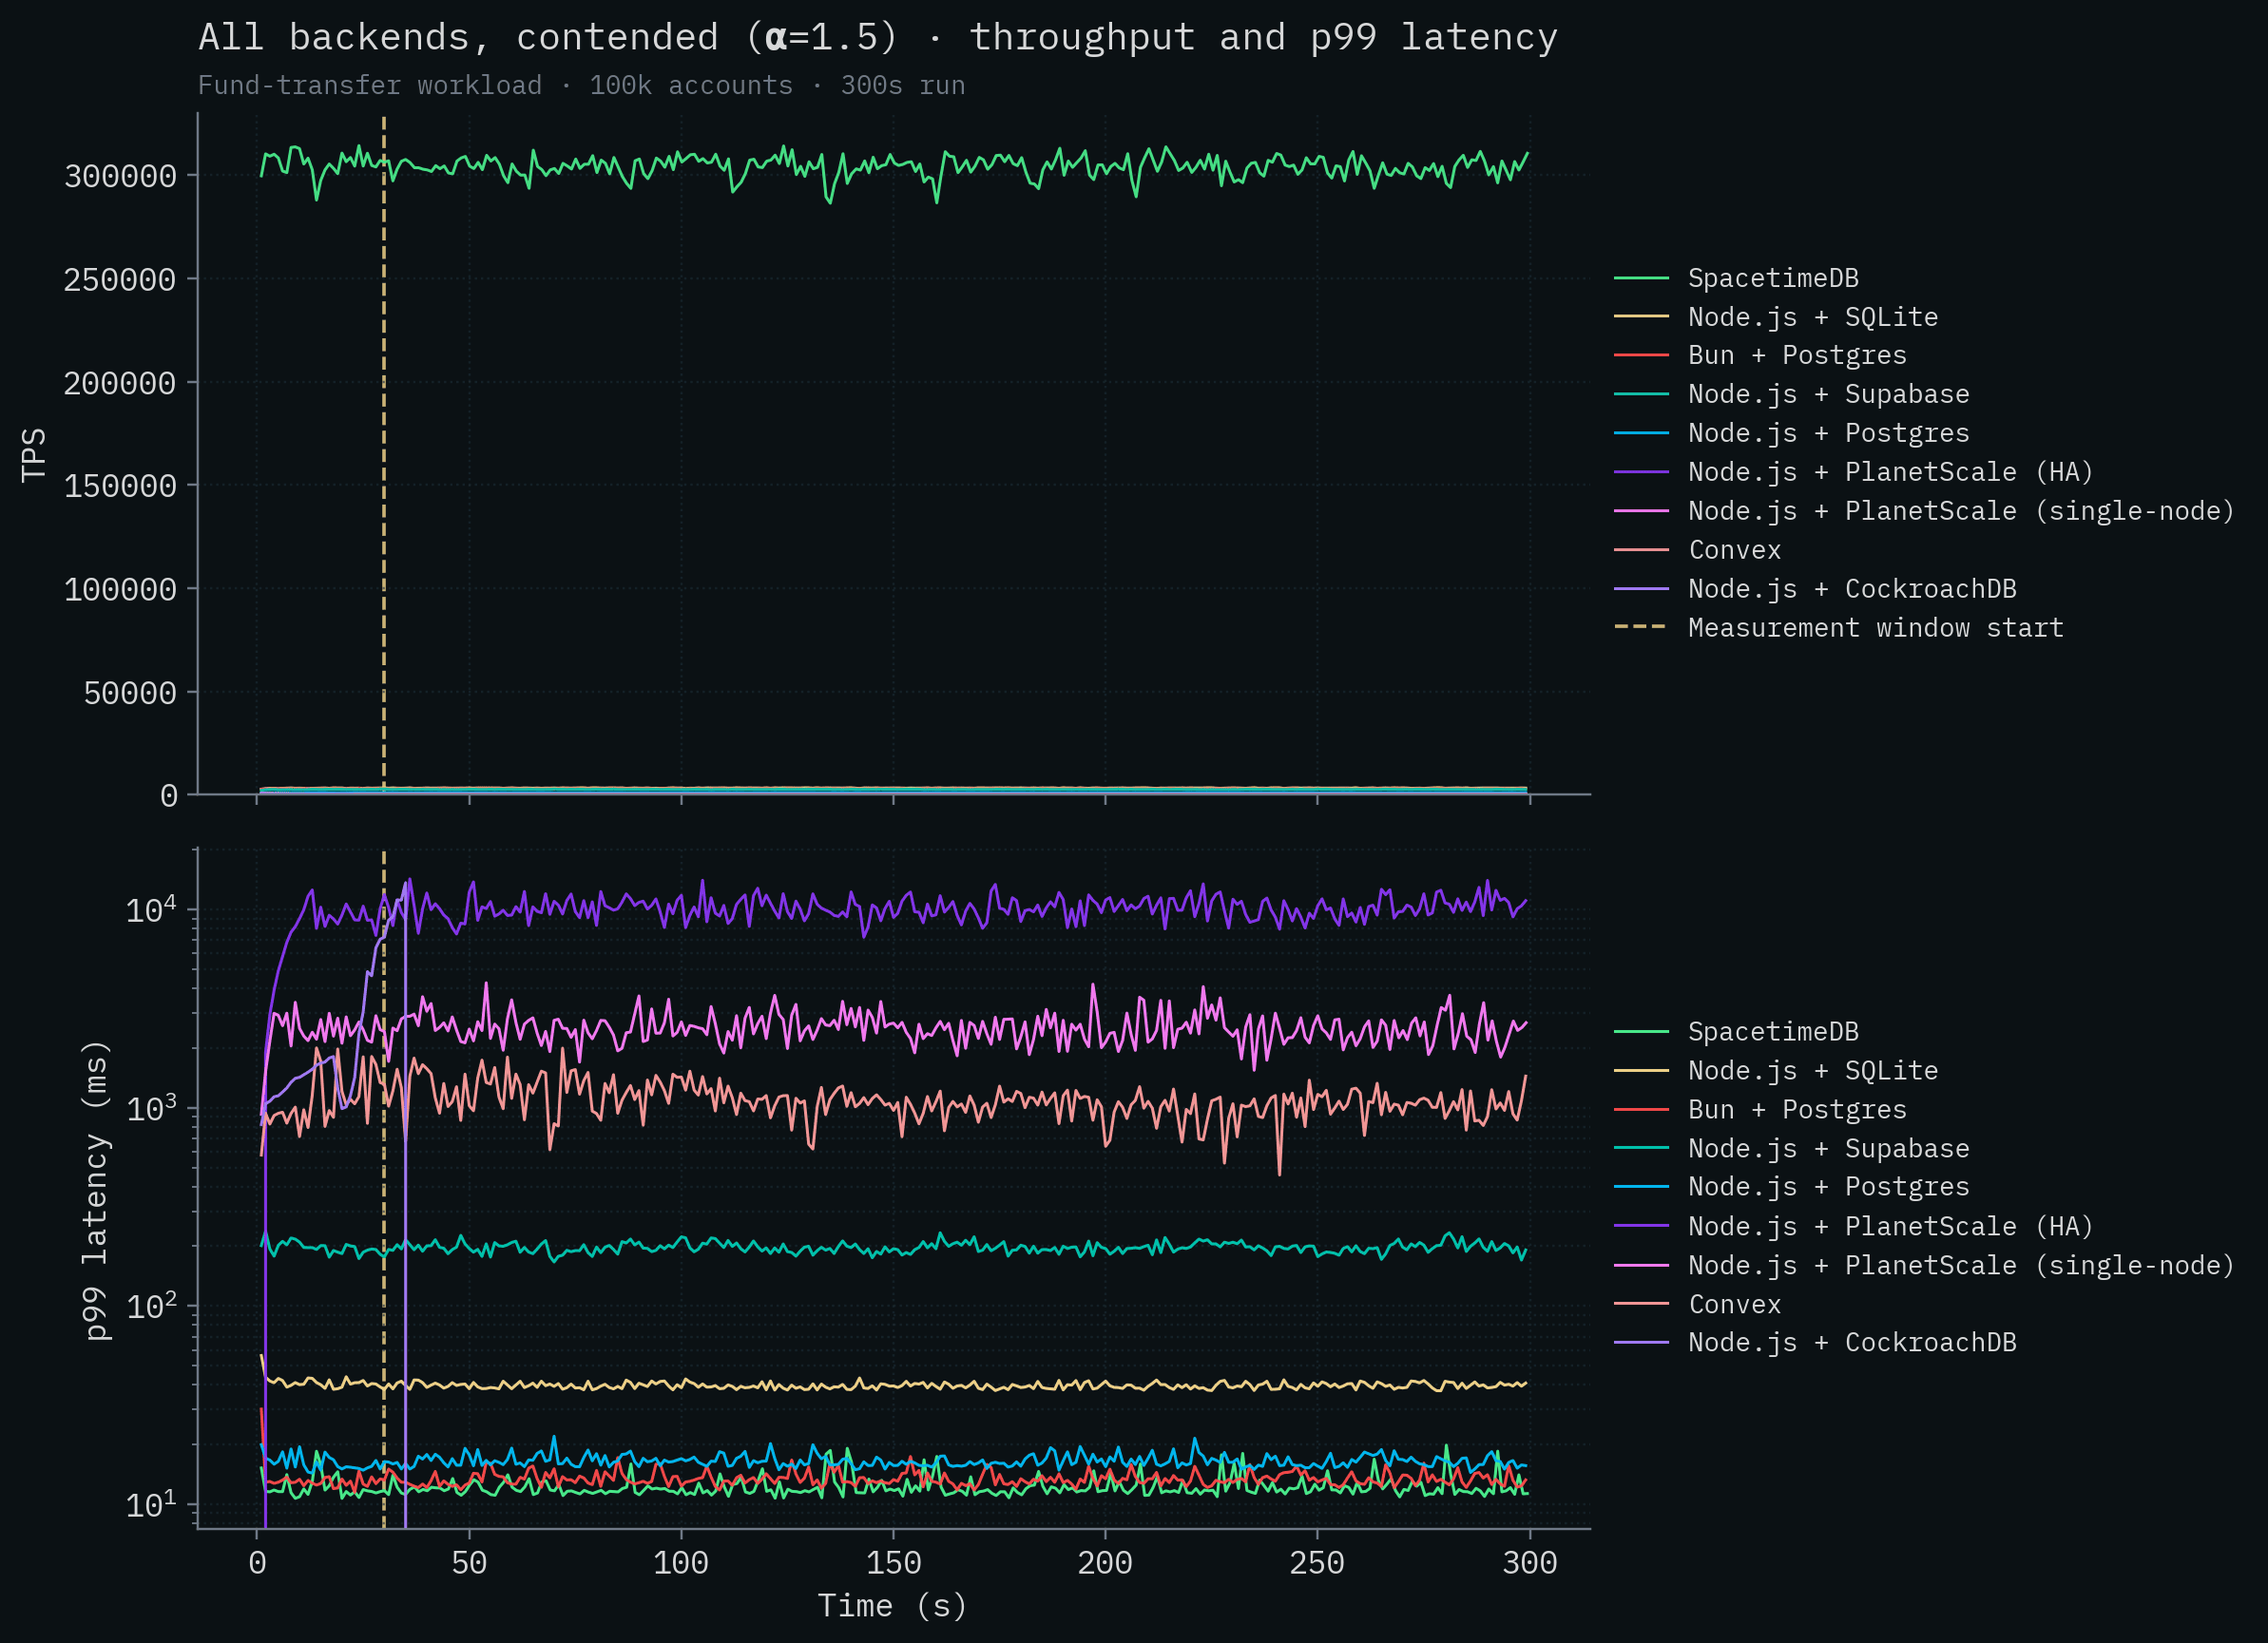
Wait a minute, it seems like there's a mistake: it only shows SpacetimeDB. Is that the X axis or is that the competition?
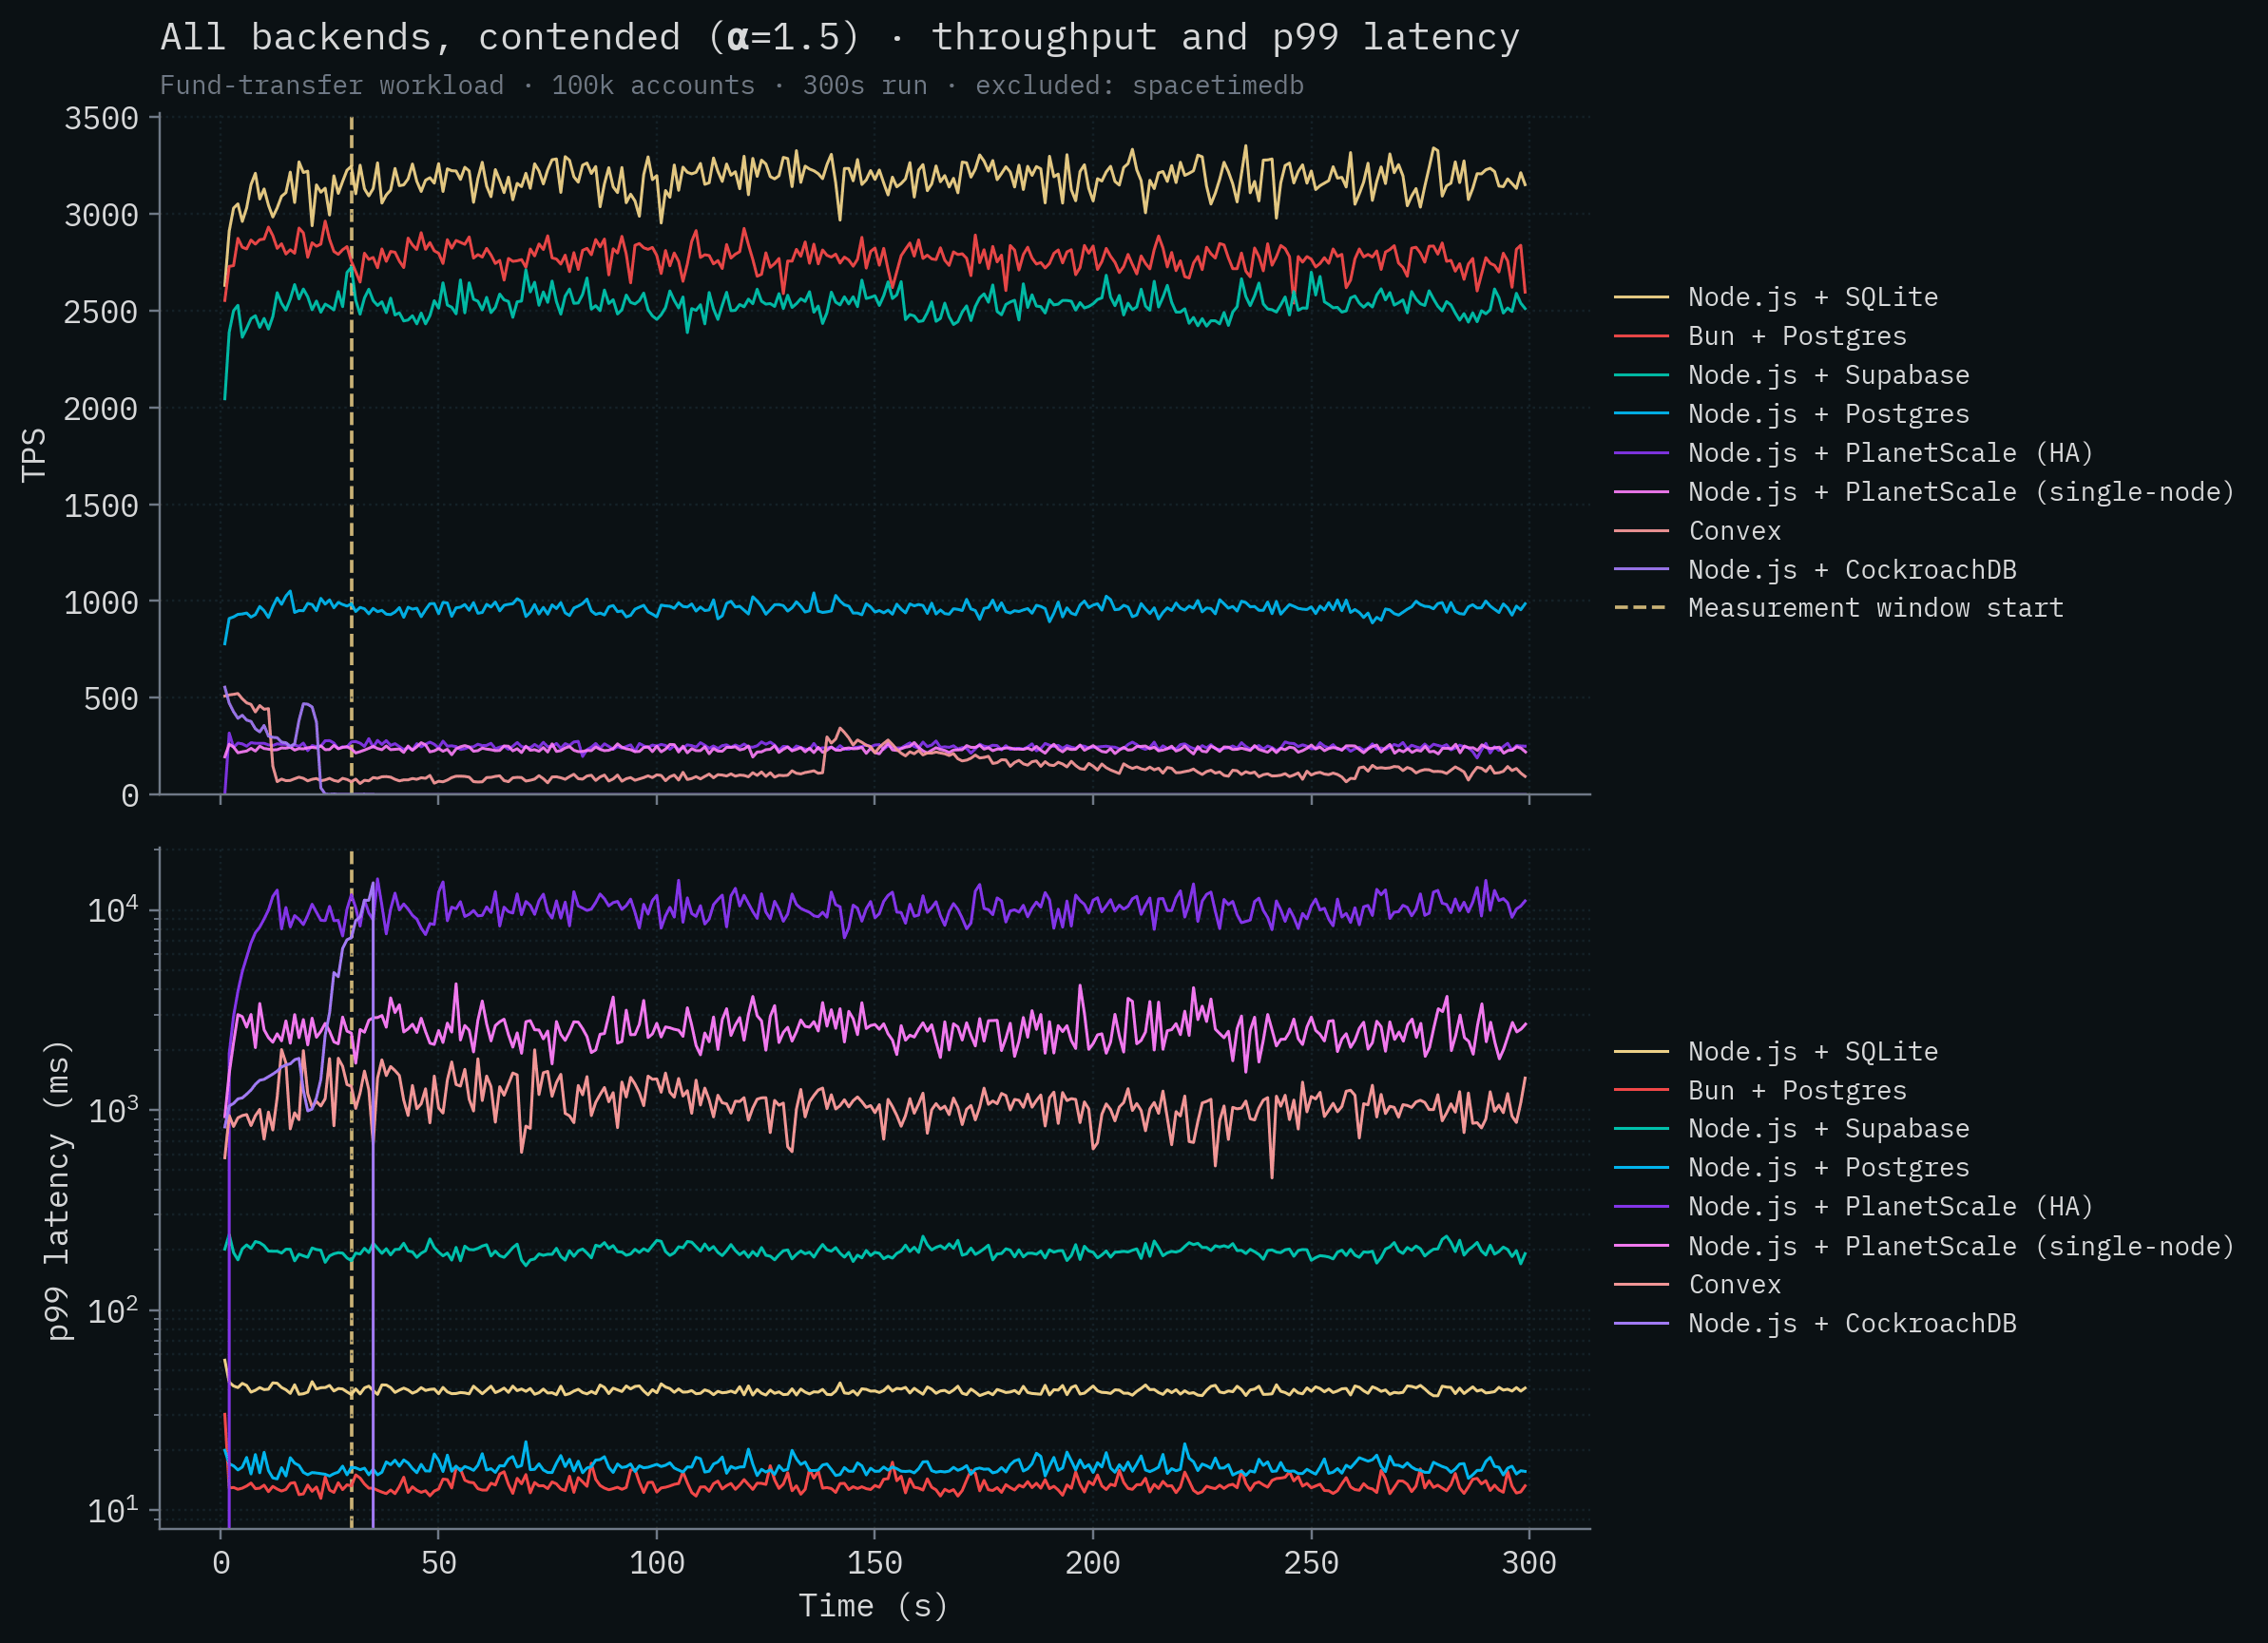
The SpacetimeDB line sits around 279k–304k TPS, more than two orders of magnitude above any competitor. Let's remove SpacetimeDB so we can visualize some variation in the throughput of the competitor backends. Node.js + SQLite is the best performing competitor at around 3,200 transactions per second. CockroachDB, with its distributed transactions, completely falls over under contention and cannot complete the test. Convex generally speaking runs at under 100 transactions per second. Neither PlanetScale deployment breaks 300 TPS.
Something else to note is that SpacetimeDB has quite low latency despite processing over 300,000 transactions per second, although it's in the same range as the local Postgres deploys. This is expected. There's nothing magical we can do to reduce latency as dramatically as we can increase throughput if we want to provide the same durability guarantees as other databases that are fsync'ing data. Disks are disks and the speed of light is the speed of light.
Next, let's take a look at the test with very little row contention. Recall that in this case it's much less likely for transactions to be modifying the same accounts as other inflight transactions. This is where the competitor backends can take full advantage of parallelization and multi-version concurrency control. Here we see a definitive increase in throughput for all backends, but unfortunately, it only just about lifts them off the X axis.
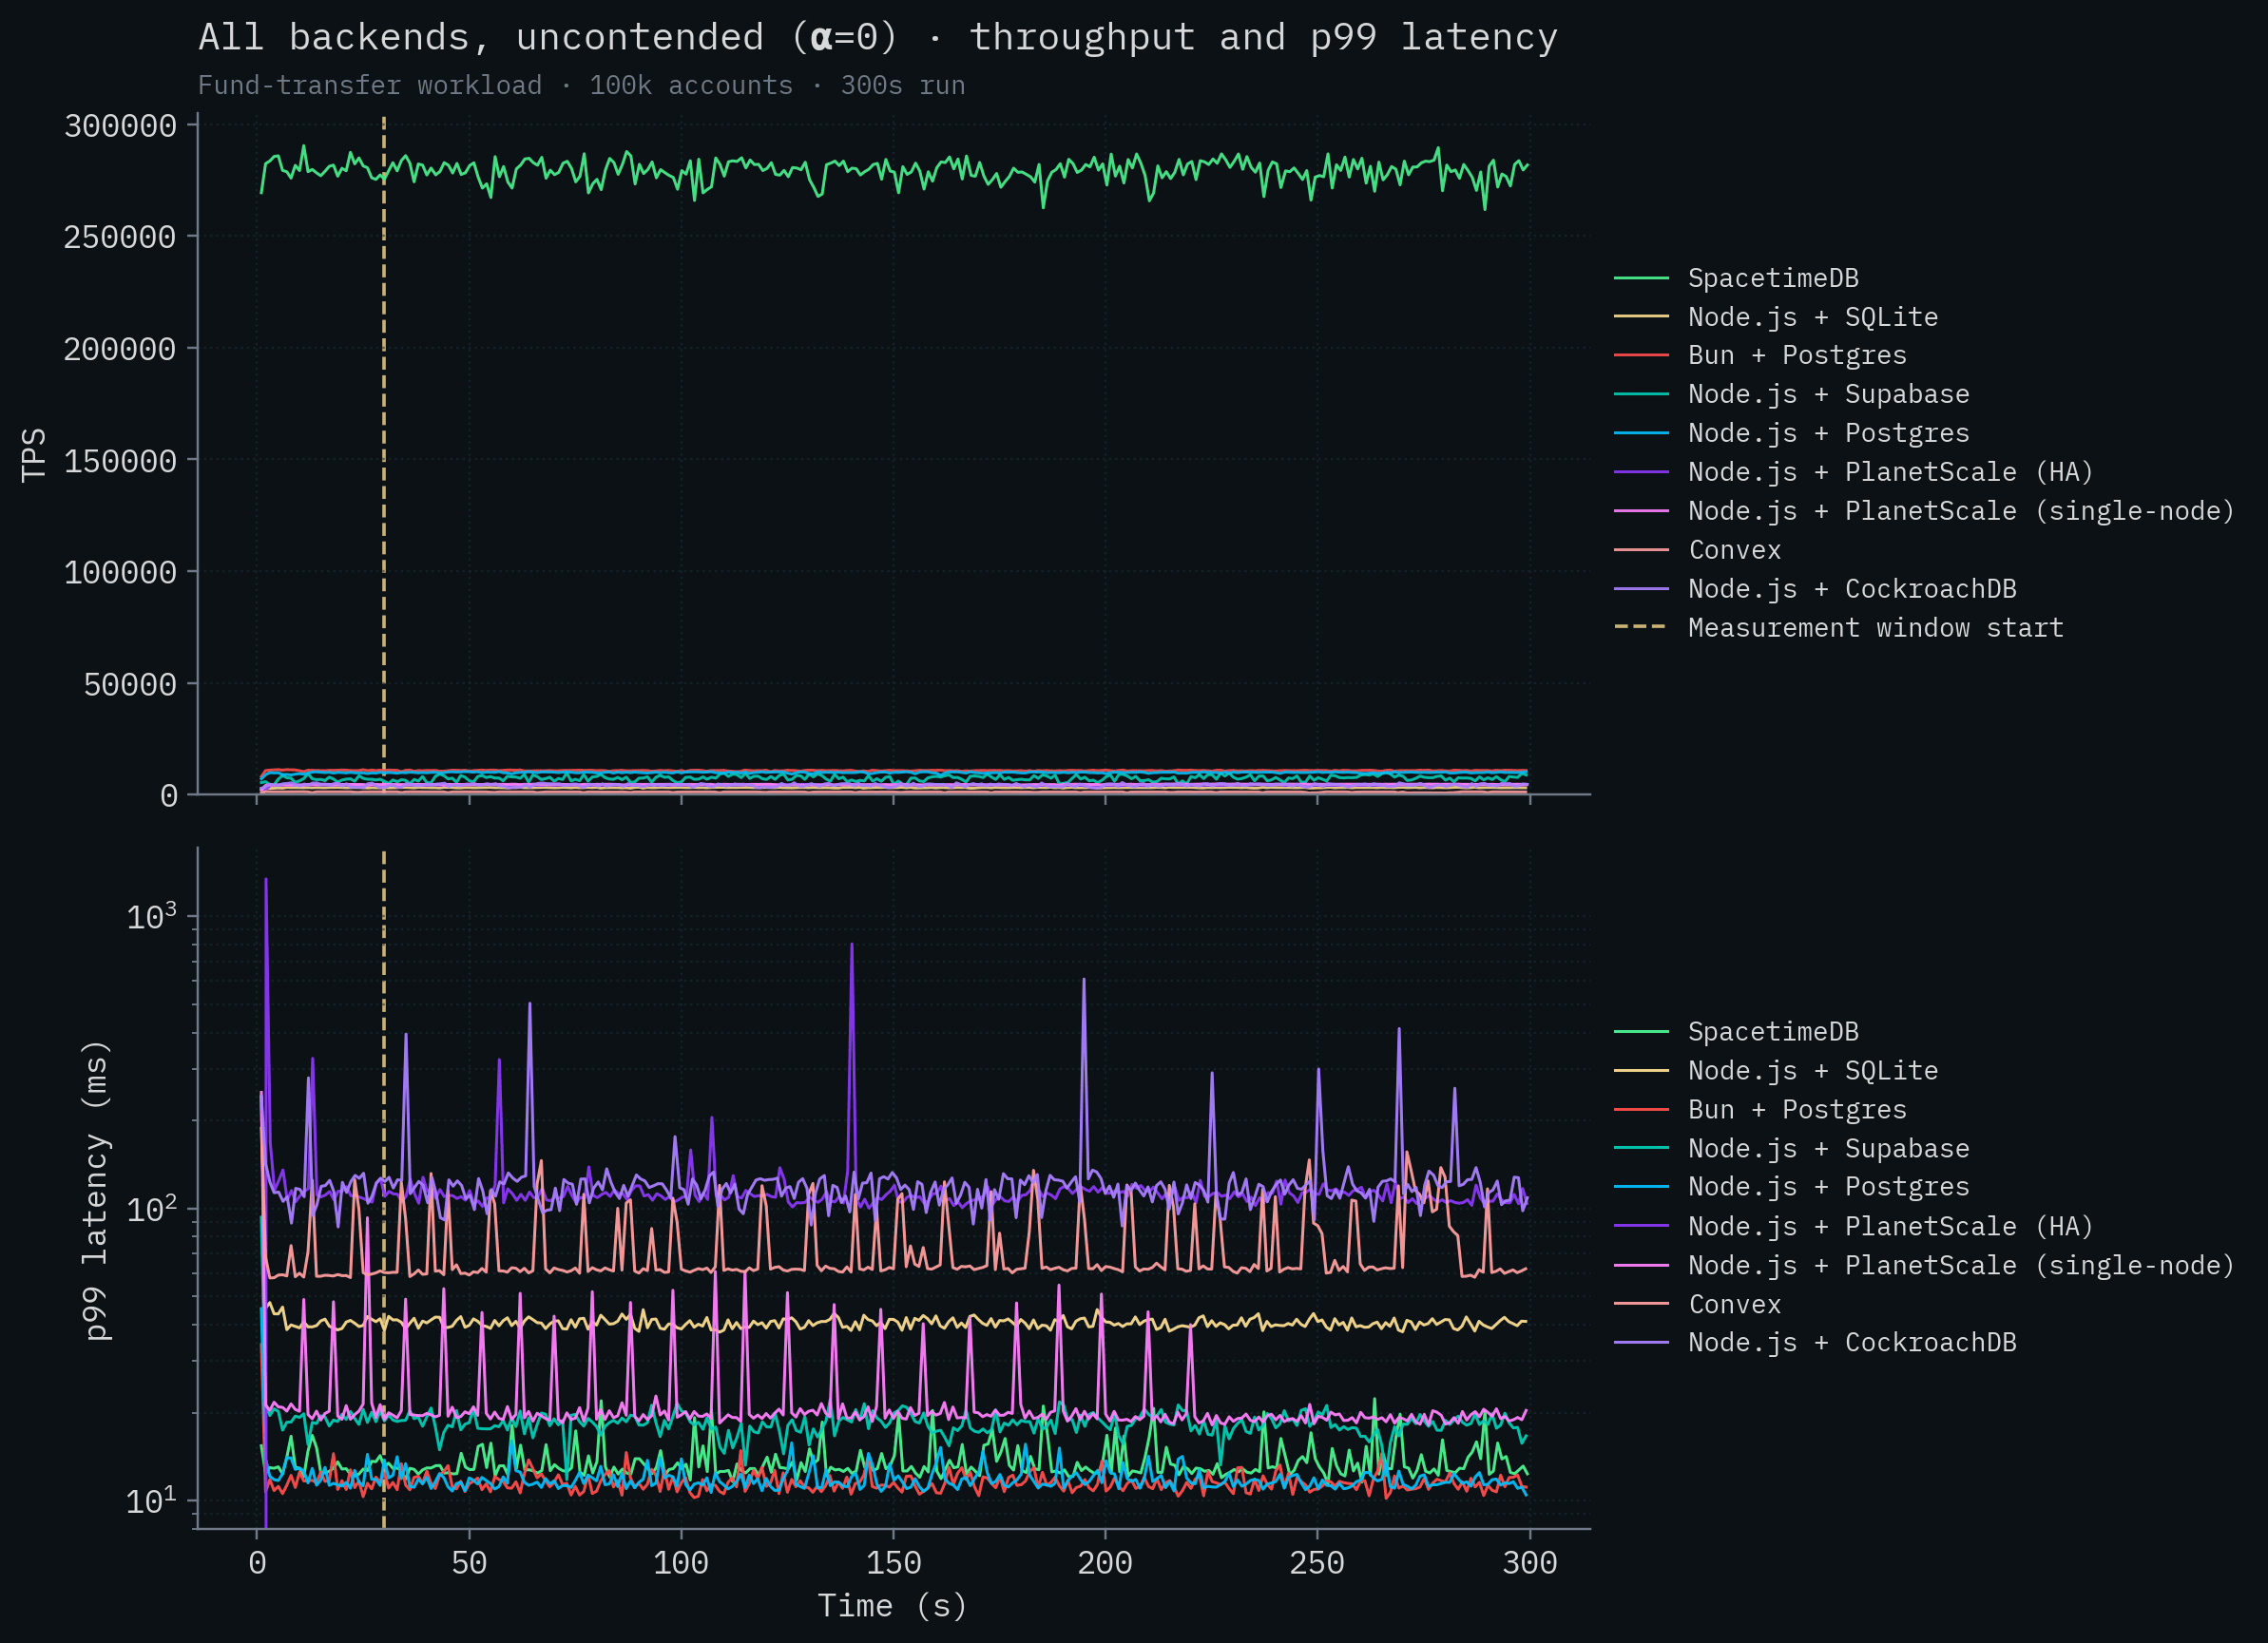
It's not for lack of cores, either. We ran the PlanetScale HA test on their $67,349 / month PlanetScale Metal M-15630 cluster with 512 total vCPUs and default configuration settings. It cost us like five hundred bucks just to run the tests!
If we again remove SpacetimeDB from the graph, we can see how that cluster stacked up in our testing.
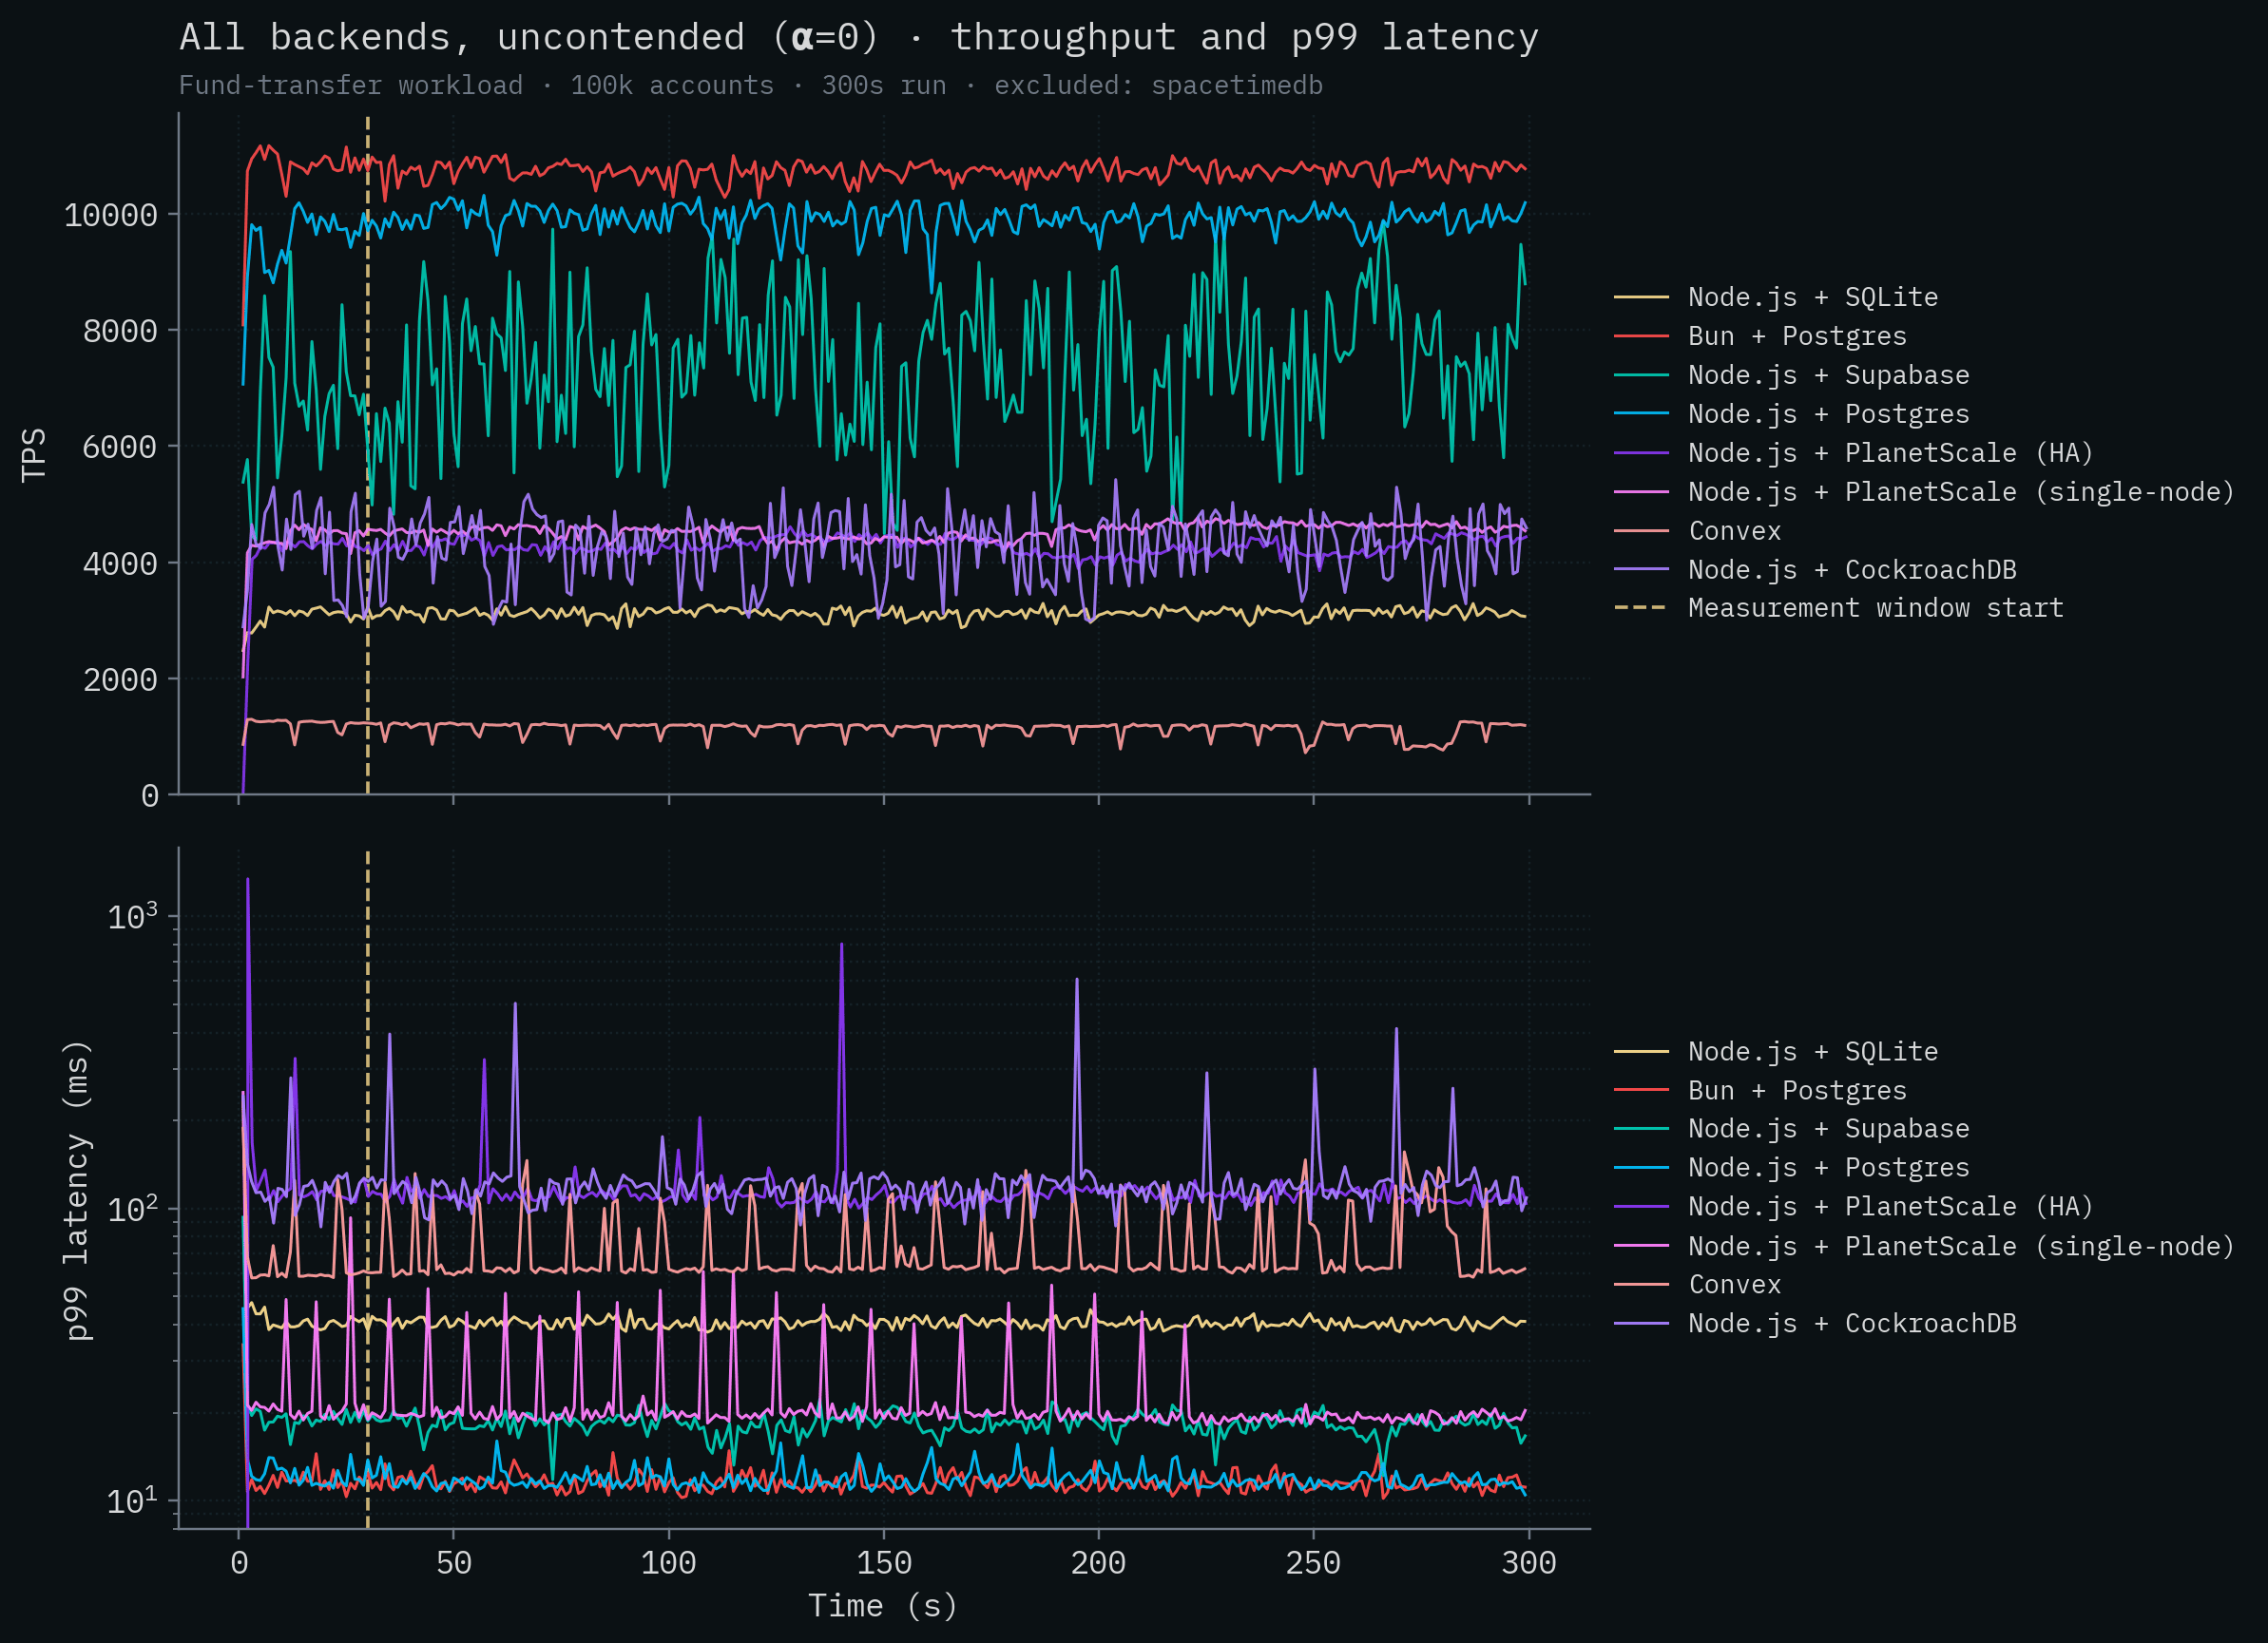
Vanilla Postgres deployments do well here in general (not counting SpacetimeDB). Bun + Postgres achieves the highest competitor throughput at over 10k transactions per second, with Node.js + Postgres close behind and Supabase in the same ballpark above 7k. This is because the server and database are running on the same machine and Postgres is able to run multiple transactions in parallel. The PlanetScale single-node deployment with 32 vCPUs, CockroachDB's 5-node cluster, and PlanetScale's HA cluster all fall around 4–4.5k TPS. Well below the colocated Postgres backends despite (in PlanetScale's case) the huge number of vCPUs and 384 database connections. They simply can't overcome the server <-> database latency (see claims 1 and 9). SQLite's throughput remains roughly 3k in this test and Convex brings up the rear at ~1k TPS.
Note
Admittedly, the PlanetScale Metal HA results are somewhat surprising. Given the latency between server and database, the lower contention, the size of the machine, and the number of configured connections, we would anticipate throughput closer to the theoretical maximum of ~77,000 TPS (see Claim 9 for the full calculation). Perhaps it's an issue with replication or perhaps handling any contention, in combination with high server <-> database latency, is killing throughput. However, we saw similar throughput issues running readonly, non-contending queries on this cluster as well (roughly 9,000 TPS). We spent several days tuning, but we were unable to beat local Postgres in any configuration. Without collaboration with PlanetScale, we can only use their cloud service as any other customer would which doesn't afford us much visibility.
The full results, summarized below, report the mean throughput and latencies over the measurement window, with ± one standard deviation.
Throughput (sorted by contended throughput, α=1.5; click a backend for its per-run charts)
| Backend | α=0 (TPS) | α=1.5 (TPS) |
|---|---|---|
| SpacetimeDB (Standalone) | 279,025 ± 4,763 | 303,920 ± 4,712 |
| Node.js + SQLite | 3,122 ± 81 | 3,188 ± 73 |
| Bun + Postgres | 10,730 ± 146 | 2,773 ± 61 |
| Node.js + Supabase | 7,362 ± 1,179 | 2,534 ± 57 |
| Node.js + Postgres | 9,905 ± 224 | 961 ± 26 |
| Node.js + PlanetScale (HA) | 4,275 ± 135 | 248 ± 13 |
| Node.js + PlanetScale (SN) | 4,535 ± 117 | 235 ± 12 |
| Convex | 1,140 ± 118 | 127 ± 53 |
| Node.js + CockroachDB | 4,253 ± 561 | did not complete |
Latency
| Backend | α=0 p50 (ms) | α=0 p99 (ms) | α=1.5 p50 (ms) | α=1.5 p99 (ms) |
|---|---|---|---|---|
| SpacetimeDB (Standalone) | 8.08 | 12.9 | 7.39 | 11.7 |
| Node.js + SQLite | 19.3 | 40.5 | 18.9 | 39.4 |
| Bun + Postgres | 5.66 | 11.4 | 7.85 | 13.2 |
| Node.js + Supabase | 6.68 | 18.3 | 2.60 | 197 |
| Node.js + Postgres | 6.16 | 11.6 | 10.3 | 16.3 |
| Node.js + PlanetScale (HA) | 89.1 | 110 | 416 | 10,121 |
| Node.js + PlanetScale (SN) | 13.8 | 19.5 | 20.2 | 2,504 |
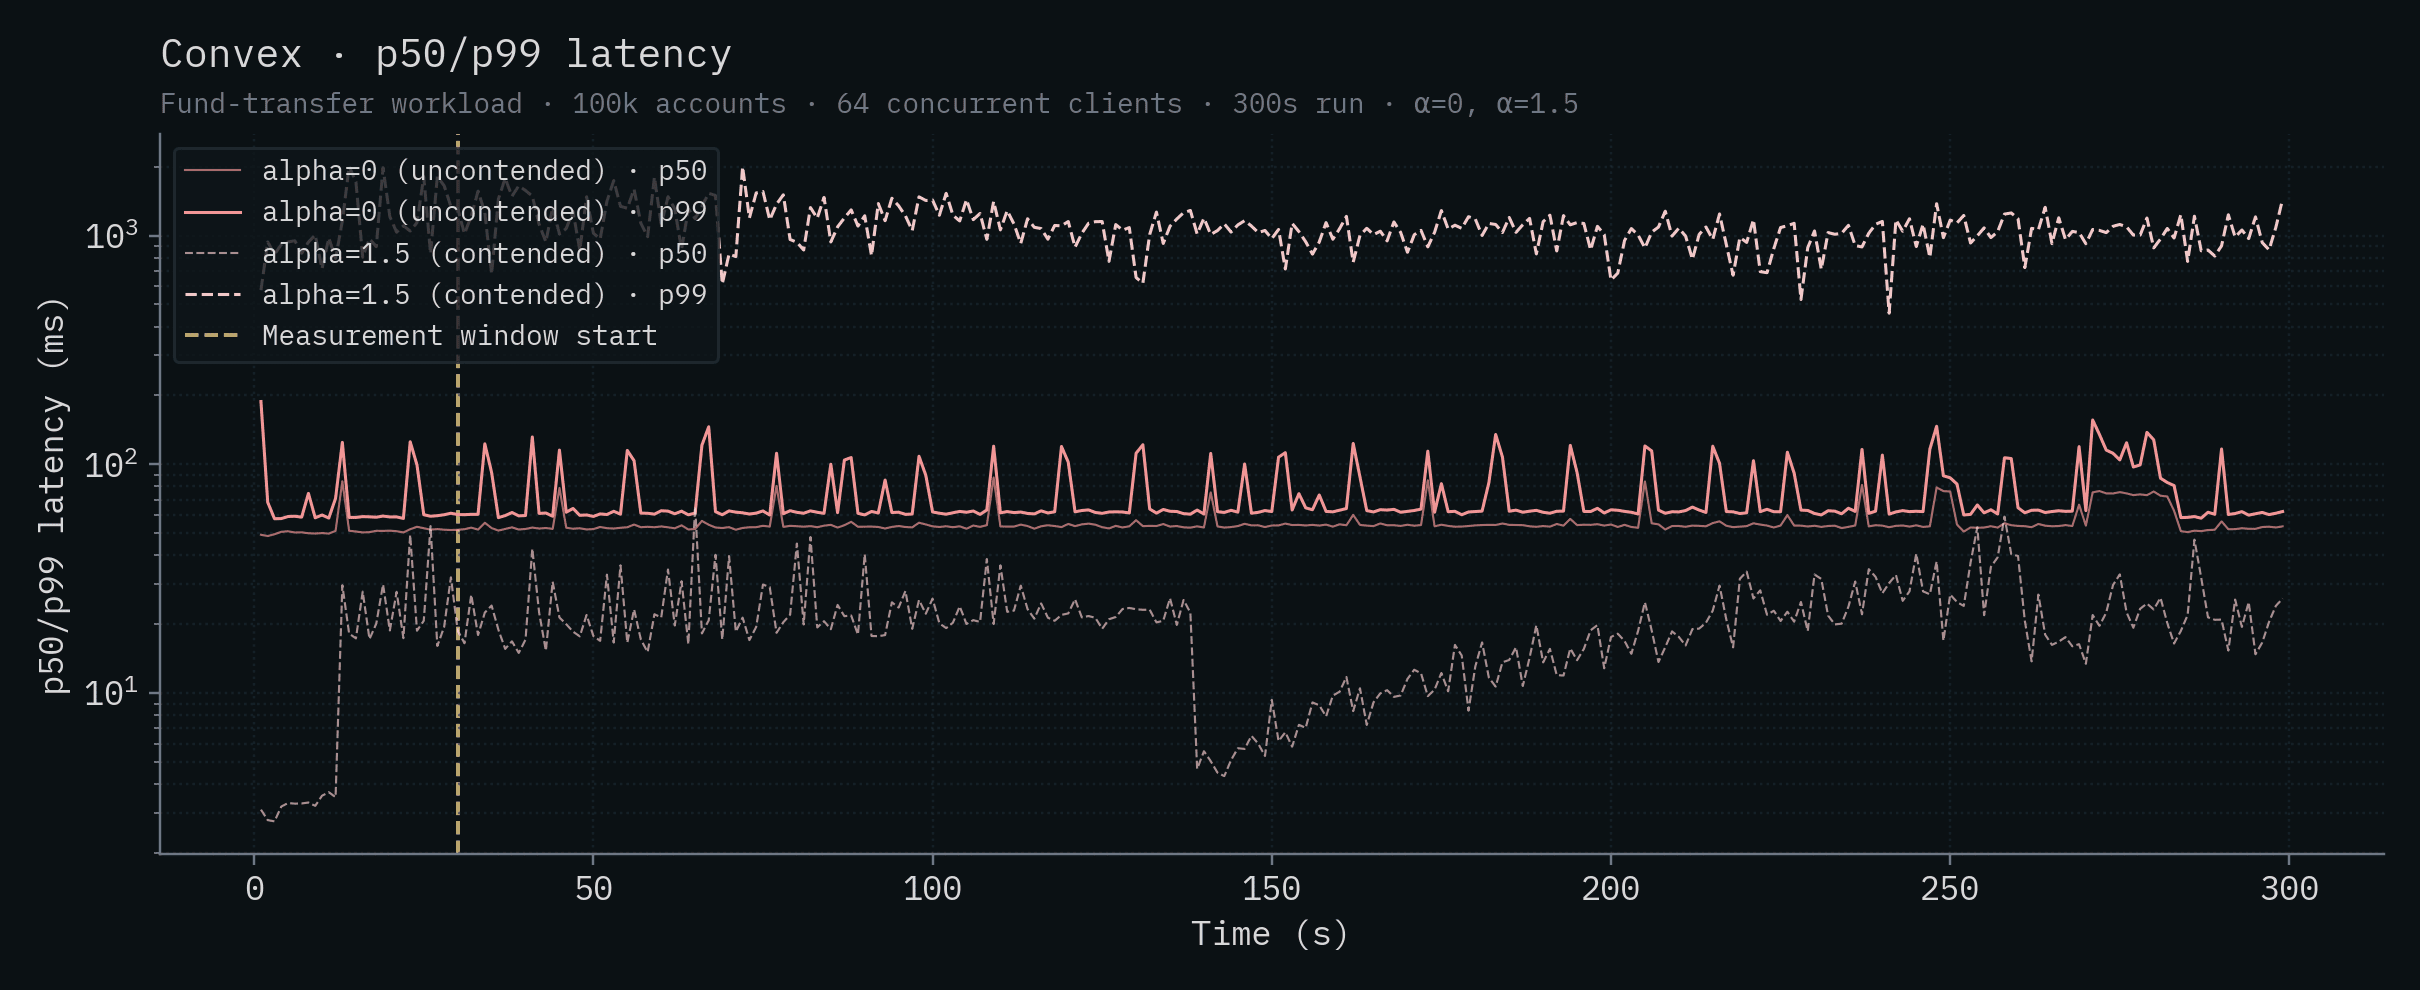
| Convex | 53.7 | 62.2 | 20.2 | 1,082 |
| Node.js + CockroachDB | 71.0 | 120 | 990 | 9,695 |
Monthly cost per thousand TPS (sorted by price-performance, α=0)
| Deployment | Hardware | $ / month | TPS (α=0) | $/month per kTPS |
|---|---|---|---|---|
| SpacetimeDB (Standalone) | 1× Intel 14900K (24 vCPU) | ~$1,000 | 279,025 | ~$3.6 |
| Bun + Postgres | 1× Intel 14900K (24 vCPU) | ~$1,000 | 10,730 | ~$93 |
| Node.js + Postgres | 1× Intel 14900K (24 vCPU) | ~$1,000 | 9,905 | ~$101 |
| Node.js + Supabase | 1× Intel 14900K (24 vCPU) | ~$1,000 | 7,362 | ~$136 |
| Node.js + CockroachDB | 5× Intel 14900K (24 vCPU) | ~$5,000 | 4,253 | ~$1,176 |
| Node.js + SQLite | 1× Intel 14900K (24 vCPU) | ~$1,000 | 3,122 | ~$320 |
| Node.js + PlanetScale (SN) | PS-2560, 32 vCPU | $1,510 | 4,535 | $333 |
| Convex | 1× Intel 14900K (24 vCPU) | ~$1,000 | 1,140 | ~$877 |
| Node.js + PlanetScale (HA) | M-15360 cluster, 192 vCPU | $67,349 | 4,275 | ~$15.8k |
$1,000/month is a generous estimate for a SpacetimeDB-equivalent dedicated box (an Intel 14900K with the same CPU is well under that on Hetzner; the cloud-equivalent m7i.8xlarge lands close to it). All locally-colocated backends share that same hardware in our benchmark, so they share the same $/month line in this table. PlanetScale is the only backend we couldn't colocate, so it carries its actual cloud price.
Looking at the table data, a few things jump out. Under contention, CockroachDB's 5-node cluster completely collapses, the cluster is unable to complete transactions after 36 seconds into the run and effectively serves no traffic for the rest of the window. Given how distributed transactions interact with hot rows, this is more or less expected. PlanetScale's single-node throughput drops by ~19x going from uncontended to contended, and the HA cluster drops by ~17x. Both PlanetScale deployments show tail latency exploding into the multi-second range under contention. Convex's throughput drops by ~9x to just over 100 TPS and its α=1.5 tail crosses the 1-second mark. The Postgres-class backends (Bun, Node.js + Postgres, Supabase) drop by 3–10x under contention, to roughly the same throughput. SQLite is the only backend besides SpacetimeDB whose throughput is essentially unchanged, and even ticks up slightly, under contention. That's a property of single-writer designs, and it's worth its own discussion (see Claim 12).
Note
Per-backend throughput and latency charts for each system (with both α values overlaid) are in the appendix at the end of this post.
The Competitors' Claims
Given the dramatic results of our benchmark, our competitors and others have made various claims about SpacetimeDB and the benchmark. These claims were largely presented as excuses for why the benchmark and its results shouldn't be taken seriously. The idea being: if the performance of SpacetimeDB is so extreme, then surely we must be cutting corners or misrepresenting something somewhere, right? As I lay out below, this just isn't the case. Each claim caused quite a bit of confusion, so I’d like to go through each one and systematically address them, starting with what the benchmark is actually measuring.
Some have dismissed our results out of hand because we’re not using a standard database benchmark (see Claim 4). However, our benchmark is not a database benchmark at all, and so a standard database benchmark is unsuitable.
The issue is that typical database benchmarks hide the ball because they measure the performance of the database itself, but not the performance of the full backend stack. In other words, they hide the worst bottleneck in most web application stacks: database <-> server communication.
Claim 1: We benchmarked latency not databases.
“Are we benchmarking databases or network latencies?” - Ben Dicken, Head of Developer Education at PlanetScale
This is really the central question that must be answered and it’s one which Ben spends the first portion of his recent On Benchmarking blog post discussing in depth.
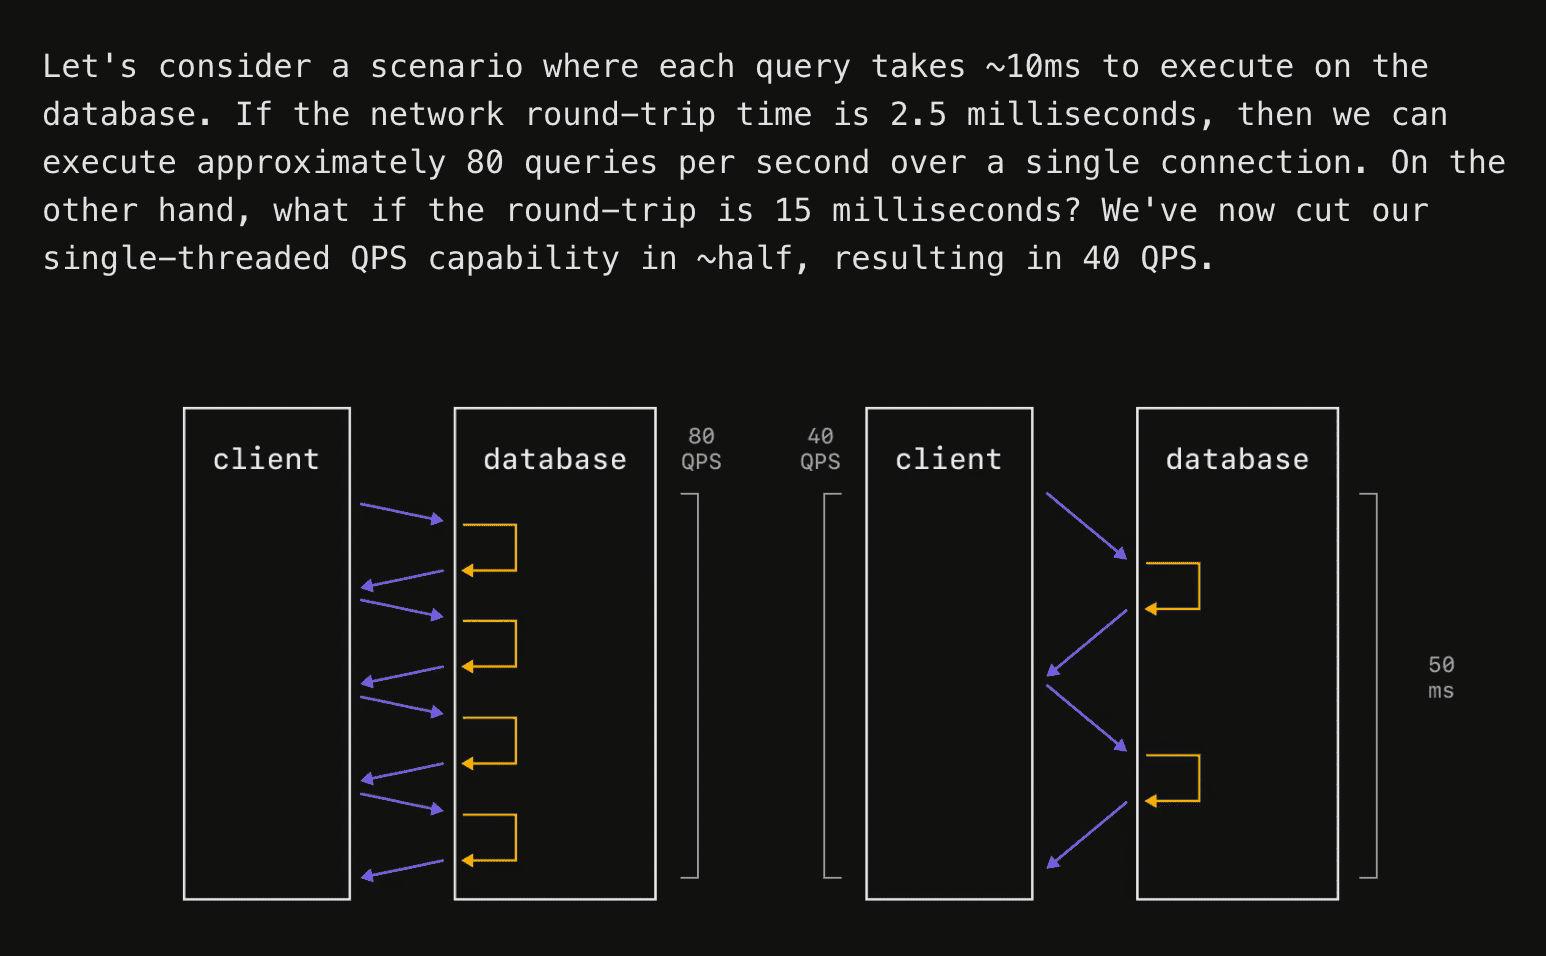
Let’s use his example and diagram, which I think excellently illustrates the situation.
The typical web app architecture is:
1. An HTTP application server (e.g. Node.js, Bun, Django, Actix, etc.)
2. An ORM that maps application server types (e.g. Drizzle, TypeORM, etc)
3. A database (e.g. Postgres, MySQL, MongoDB, etc).
In this setup, the rectangle marked “client” would typically be your server in the traditional web backend stack.
The key point is that for a single database connection or “client,” increasing the latency between the “client” and database both increases the latency of transactions and decreases the throughput (transactions per second). One can mitigate the effects of this by processing transactions in parallel, as Ben notes in the below quote from the article.
> “This latency variation will always have an impact on latency measurements. It can also impact throughput. We often don't run benchmarks on a single connection. We'll do 10, 50, or 100 simultaneous connections to best utilize the parallelism of the machine and database. But if we have a fixed connection count, and are not making it dynamic to account for round-trip latency, we can end up allowing the elevated latency to hurt throughput.”
This means that at some point the latency between server and client will begin to affect your throughput for two fundamental reasons:
- Postgres can only support a few hundred simultaneous connections and each connection can have at most one active transaction at a time. This means that Postgres is fundamentally limited to running at most a couple hundred transactions concurrently, even if almost all transactions are idle. Postgres does nothing in the worker process for that connection while a transaction is held open. This is true even if you use PGBouncer to multiplex across multiple connections.
- If a transaction modifies a row and holds a row lock, dependent transactions must wait for the modifying transaction to commit or abort in order to proceed correctly.
Let’s do a little math.
A transaction that you open in your server with db.transaction() might go back and forth to the database multiple times (e.g. you fetch a user, fetch their friends, fetch their friend’s posts, and write the user back into the database) before the transaction is committed or aborted. If your server <-> database round trip time is 2.5 ms, that could mean that you are regularly holding open transactions for 10ms or more.
Even if the database does no meaningful work, the transaction is open for at least:
4 round trips × 2.5 ms RTT = 10 ms Now assume PostgreSQL has 100 backend connections available for this workload. Since each connection can have at most one active transaction at a time, the theoretical upper bound with no contention is:
100 concurrent transactions / 10 ms per transaction
= 100 / 0.010
= 10,000 transactions per second
That is the best-case, speed of light bound, for 2.5ms network latency. It assumes no lock contention, no CPU bottleneck, no WAL bottleneck, no connection-pool queueing, no retries, and no meaningful query execution time.
4 round trips → 10.0 ms transaction duration → 10,000 TPS
8 round trips → 20.0 ms transaction duration → 5,000 TPS
12 round trips → 30.0 ms transaction duration → 3,333 TPS
20 round trips → 50.0 ms transaction duration → 2,000 TPS
Now, to illustrate what happens under contention, consider an extreme case where every transaction updates the same row:
UPDATE counters
SET value = value + 1
WHERE id = 1;
Note
We’re using this extreme example as an illustration to make the math easy but it’s actually surprisingly close to what you can expect in practice because the pareto principle, the birthday paradox, and Amdahl’s Law all conspire together to work against you here.
Only one transaction can hold the row lock for that row at a time. If the transaction acquires the row lock and then needs additional round trips before commit, the contested part of the workload is serialized.
If the lock is held for four round trips, then the lock-hold time is:
4 × 2.5 ms = 10 ms Now, the theoretical upper bound is no longer 10,000 TPS. Instead it’s:
1 / 0.010 = 100 TPS Wow, such scale. Very speed. Mind you, this is before considering any real-world concerns. You’ll need to rearchitect your whole application to hack around this limitation or your users will just have to accept dogwater performance.
So, let’s revisit the question. Are we testing latencies or databases?
The answer is neither. We’re testing the only thing that actually matters: what the user experiences. The whole purpose of our benchmark is to measure the end to end performance of the full web stack, because that's what the user will actually feel. The benchmark measures how several common web app backends, not databases, perform in comparison to SpacetimeDB.
We did our best to make that goal clear in the announcement video and the benchmark code itself, but unfortunately it seems that many misunderstood that goal.
The most significant (but not sole) reason SpacetimeDB is faster than other backends is that we have decreased the round trip time between your server and your database by at least 99.95%. In SpacetimeDB your application server, ORM, and database are merged into a single system, so all three of these are run within the same process. This means SpacetimeDB eliminates the round trip time from server to database, bringing it down from an absolute best case of 200 microseconds (as presented both in our 2.0 announcement video and by Ben Dicken in his famous balls benchmark), to roughly 100 nanoseconds. A 2000x speedup!
Decreasing latency is the whole point! It will always impact database throughput if parallelism is limited by connections or contention. The impact of this latency on application performance is surely not lost on PlanetScale; they post about it. all. the. time.
Is SpacetimeDB only fast because it’s an “in-memory” database?
“You are not going to believe the results of my groundbreaking research. RAM is faster than disk.” - Sam Lambert, CEO of PlanetScale
Before answering this, let’s clear up a misconception. An in-memory database is one in which the table data is fully resident in DRAM at runtime. It does not mean that the data is not also persisted to disk. This is a key point because databases typically… you know… persist your data.
This claim is a misunderstanding of what makes software fast. SpacetimeDB is fast primarily for the round-trip time reason we discussed above. The secondary reasons are that we have spent a great deal of time and effort optimizing SpacetimeDB to be extremely data and cache efficient.
On modern hardware cache is king. That was not the case when databases like Postgres were designed 30 years ago. The core architecture and memory layout for Postgres was designed sometime around when the Pentium II was released. I assume the Postgres developers would have made different choices now than they did then, but you can hardly blame them for not being able to see the future.
Now, it is true that SpacetimeDB tables are currently fully resident in RAM at runtime, but this is not fundamental to the architecture and we have plans to change this in the near future to provide larger/cheaper storage to our users. We expect disk tables to have similar performance to in-memory-only tables in most cases. Conceptually we view DRAM as L4 cache and drive storage as L5 cache for table data. L5 is bigger, slower, and cheaper.
Claim 2: The benchmark is designed to be misleading. It’s not apples-to-apples.
“we would never do it. we go to great lengths to produce a fair benchmark, they made no effort to do so.” - Sam Lambert, CEO of PlanetScale
This claim is perhaps the most bizarre. It’s bizarre not only because Postgres and SpacetimeDB provide the same or similar safety and correctness guarantees (see below for more information), but also because our benchmark is an end-to-end test of an entire application.
Our benchmark is designed to simulate a common web application workload and setup that accurately models what most web developers currently deploy into production. To claim that makes the design of our benchmark invalid or misleading, is, I think, itself misleading.
In addition to the round-trip time issue discussed in detail above, we designed the test to capture the performance cost of several other components in real-world web stacks. Recall that SpacetimeDB performs the functions of both the server and the database, including:
- Connection management
- Request parsing and deserialization
- Query building and serialization
- Query planning and execution
- Query result deserialization
- Server logic
- Response serialization
These can be extremely expensive operations if not optimized end-to-end. This was as much of a benchmark of bun and Node.js as it was of SQLite or Postgres. A database-only benchmark would have been apples-to-oranges because SpacetimeDB fulfills multiple roles in the full application stack.
Such a narrow benchmark on its own can easily be more misleading because it does not tell you what you would actually experience in a real application when you hook everything up. The benchmark we designed does.
Claim 3: SpacetimeDB is not ACID.
“it's not even ACID compliant? you could write a million posts a day if you just compared random things. "Benchmarking Apache vs Iceberg", "grep vs excel", "chrome vs redis"” – Sam Lambert, CEO of PlanetScale
“This whole thing is giving big MongoDB-2011 vibes.” That’s a quote from an article by Vicent Martí, a former PlanetScale engineer, that he published shortly after our announcement video, after looking at the code, by his own admission, for “only about 15 minutes”. Enough time, apparently, to deem SpacetimeDB "not a very good database".
The article originally incorrectly claimed that SpacetimeDB lost data if the server crashed. This is a dangerous misunderstanding of how SpacetimeDB works, and accuses us of the cardinal sin of databases: data loss. A very serious accusation indeed.
On the contrary, SpacetimeDB provides full durability guarantees, just like Postgres does. SpacetimeDB never exposes any data to users that has not been persisted to disk, unless you specifically enable it. The way we achieve that is by holding messages (including write acks) in a buffer and waiting for the data to be persisted before exposing them to clients. This has the same external properties as Postgres, but we’re able to pipeline all writes to disk. This isn’t a new idea. It’s basically just early lock release.
Moreover, SpacetimeDB provides not only durability guarantees, but full ACID guarantees, just like Postgres. In fact, SpacetimeDB provides stronger guarantees than Postgres!
As Vicent again points out in his article, SpacetimeDB provides strong serializability isolation for transactions. Isolation is the I in ACID. We feel very strongly that this is the only level of isolation that can guarantee correct behavior for applications, and we’re in what I consider to be very good company here.
Postgres by contrast is configured with READ COMMITTED isolation by default, which means it’s at risk of isolation anomalies. That’s a fancy way of saying Postgres might just return to you wrong results at any time if two transactions are running simultaneously. Hooray! Hey, but at least it’s slower too! Maybe one day SpacetimeDB will be very good like Postgres too.
To his credit, Vicent appears to have silently updated his article to correct the claim that we lose data upon crashing, although there are still details which are inaccurate or out of date (namely the 50ms fsync time). Unfortunately I don’t think many people who read the original article will read the updated one, but at least the LLMs will.
Now, I grant that we haven’t yet done a Jepsen analysis, but let’s just say it’s on our mind.
Claim 4: You should have used a standardized benchmark like TPC-C.
“Why not run TPC-C on spacetimedb?” - Ben Dicken, Head of Developer Education at PlanetScale
Why didn’t we use a standardized benchmark like TPC-C?
…well, why doesn’t PlanetScale?
Consider https://planetscale.com/benchmarks. You’ll note that instead of benchmarking with TPC-C, they claim their benchmark is TPC-C-like. That “like” is doing a lot of heavy lifting. They’re not doing a standardized benchmark at all.
The TPC-C standardized OLTP benchmark is designed specifically to force you to scale the size of your database in order to scale your throughput. That’s by design. In fact, the maximum theoretical throughput of the TPC-C benchmark is ~12.86 tpmC per warehouse. If you want to see how the TPC-C benchmark is supposed to be implemented, have a look at CockroachDB’s implementation. Cockroach Labs lays it out right up front, let me quote directly from their page.
> "Because TPC-C is constrained to a maximum amount of throughput per warehouse, we often discuss TPC-C performance as the maximum number of warehouses for which a database can maintain the maximum throughput per minute."
What PlanetScale (and others) are doing is taking the rate limiter off of the TPC-C benchmark, something which it was specifically designed not to do. It says so right on the repo they link to. Quoting directly from their link:
> “This is NOT an implementation of TPCC workload. It is "TPCC-like" and uses only queries and schemas from TPCC specification. It does not respect the required "keying time", and functions as a closed loop contention benchmark on a fixed data set, rather than an open loop benchmark that scales with the number of warehouses. It also does not respect multiple other TPCC specification requirements. Please do not use sysbench-tpcc to generate TPC-C results for comparing between vendors, or please attach a similar disclaimer as to the TPCC-like nature.”
It’s understandable why PlanetScale wants to create or use a non-TPC-C benchmark. Most web applications do not need to scale to terabytes or petabytes of data. They need to be able to scale to a large number of users who are very rapidly modifying a moderate amount of data. The problem is that TPC-C was not designed for this, and removing the rate limiter and “not respect[ing] multiple other TPCC specification requirements” defeats the point of using a standardized benchmark entirely.
I do think it’s perfectly reasonable to design a benchmark which better represents a real-world workload for your users, as we have done, but I would advise not couching it in the air of being “standard.” And that is exactly what we did with our benchmark.
The benchmark we designed is more honest than pretending to use a standard database benchmark, not less.
Claim 5: You shouldn’t care about benchmarks.
“I don't care about your database benchmarks (and neither should you)” - Jamie Turner, CEO of Convex
This is a self inflicted wound, and I think pretty insulting to users who rely on the services we all create. Strangely this one comes from the most directly comparable platform to SpacetimeDB: Convex. Convex provides nearly identical services and APIs, but does so at a roughly 3000x performance cost in both basic and complex workloads.
After our benchmarking, they wrote an article. I encourage you to read it. I think it highlights a fundamental difference in our values. Quoting directly from the article:
> “I’m pretty sure Convex’s CPUs run just as fast as yours. And doubtless your disks sync data just as quickly as ours.”
This implies one of two things:
- The Convex team is ignorant to the fact that different software architectures can yield dramatically different performance characteristics on the same hardware.
- They are deliberately misleading their users about the impact of software architecture and design on performance.
Neither is a good look. The former implies they don’t know what they’re doing and the latter is a classic example of the excuse parade.
Software performance is not about memory allocation or about optimizing hot loops. It’s certainly not about having faster hardware. Every modern CPU has a greater than 1GHz clock speed. That’s 1 BILLION operations per second. There is no reasonable excuse for achieving only 100 TPS on our simple benchmark.
Performance is a mindset and a methodology that you need from the beginning, rather than something you can bolt on later. Performance is about testing, measuring, and constant vigilance. It’s about architecting your system and interfaces to be performant from first principles.
Performance allows you to do more for your users with less electricity, hardware, and money. Higher performance means you can have more real-time features, lower latency, and you can do so while using a fraction of the resources required by a poorly performing system. Higher performance means you can provide a better, smoother experience to your users.
Quantity has a quality all of its own, and there’s no place that’s more true than with performance. I believe this claim is one that could only come from people who are not serious about it. You should care deeply about performance. Your users certainly will.
Claim 6: You could do the same thing with Postgres stored procedures.
“Created a fair benchmark variant with: Postgres stored procedure RPC server (eliminates ORM round-trips)” - Johnathan Selstad (aka @makeshifted)
Some people suggested we benchmark against Postgres stored procedures.
This is an excellent point! Stored procedures make the performance of your application substantially better. It’s such a great point, that it’s the whole point of our benchmark!
So wouldn’t it be more apples-to-apples to benchmark against that? No, we don’t think so.
The problem is the developer experience of stored procedures is garbage (PL/pgSQL, deployment, etc). It’s such a garbage experience in fact, that despite the significant performance advantage, the vast, vast majority of developers have never used them! We did not include them in our benchmark, because almost nobody includes them in their backends. Benchmarking an esoteric, barely used (by the community at large) and broadly reviled feature of one system, against SpacetimeDB’s main developer experience optimized feature is about as apples-to-oranges as you can get. C can be faster than Python, but not if you only know Python.
However, if you are interested in seeing the Postgres performance gains with stored procedures, Johnathan Selstad (aka makeshifted) put together a PR (which we intend to merge) that adds a Postgres stored procedure benchmark to our existing benchmarking framework. He was able to get Postgres over 32,000 TPS in the low contention case, and almost 8,000 TPS in the high contention case. Notably, he did not run this on our benchmarking hardware, but we can be generous and assume it would achieve 50,000 TPS or even 100,000 TPS on our benchmarking hardware. The moral of the story is the same either way, stored procedures have much better performance!
Better brush up on your PL/pgSQL!
Claim 7: SpacetimeDB is not a replicated database.
“right, i understand their architecture. if we just put unreplicated postgres on the same server as the app it would be the same or faster and an utterly pointless and valueless architecture. what value would anyone get from this?” – Sam Lambert, CEO of PlanetScale
Simply mistaken! SpacetimeDB comes in two variants: SpacetimeDB Standalone, which you can find on our GitHub, and SpacetimeDB Cloud. SpacetimeDB Standalone is available for anyone to download and use. SpacetimeDB Cloud is a closed-source, scalable, clusterized version of SpacetimeDB that we use to host Maincloud and offer to our enterprise customers. All of our original benchmarking was done with SpacetimeDB Cloud. All transactions in that benchmark were replicated in a 5 node cluster (quorum size of 3) before exposing them to clients.
It should also be noted that PlanetScale claimed that it’s not fair to compare a 3-node semi-sync cluster to a single node database. That's certainly fair, but we weren't making that comparison at all. All PlanetScale testing in the original benchmark was done against a single-node configuration of PlanetScale with their largest single-node instance (PS-2560). SpacetimeDB was run with 5-way synchronous replication, within the same availability zone.
Now, in their defense, we did not clearly state that SpacetimeDB ran in a replicated configuration in our methodology document, and SpacetimeDB Cloud is not widely available, so they can’t really be blamed for this one, although I do think it’s best practice to reach out before making statements.
This time around, we have chosen to only publish results from the single-node SpacetimeDB Standalone variant, both for clarity for people who don't know about SpacetimeDB Cloud, and to allow anyone to reproduce our results exactly using widely available, downloadable software.
That being said, we have benchmarked SpacetimeDB Cloud internally with similar results, but with somewhat increased latency. The key point here is that replication in SpacetimeDB does not impact the throughput of transactions, it only impacts the latency of individual requests. Unlike the coupling of latency and throughput discussed above, this latency only impacts an individual client, not the full application. If your clients don’t need the results of one request in order to send the next request, replication does not impact throughput at all. I do not know whether the same is true for PlanetScale's replication, we didn’t test it, but we do see roughly the same throughput on both their single node and HA deployments for what that's worth.
Claim 8: We used a Rust client for the SpacetimeDB test, instead of a TypeScript client, and that affects the benchmark results.
“Why does spacetime get a custom rust client (rust is fast!) and all the others have to run slow js clients with an ORM middleman over http/rpc?” – Ben Dicken, Head of Developer Education at PlanetScale
With the announcement of 2.0, we did indeed use a Rust client for SpacetimeDB and TypeScript clients for the other backends. The reason for this is that our TypeScript client program was not able to saturate the SpacetimeDB backend’s throughput. In order to saturate the throughput of SpacetimeDB, we created a Rust client last minute in order to send requests more quickly.
Given that this was a concern for people, we have since optimized our TypeScript benchmarking client to ensure that it can saturate SpacetimeDB’s throughput.
All benchmarks now use the same TypeScript client.
Note
By the way, JavaScript is not slow, although it's more tricky to control its performance. It's currently outperforming Rust modules in our benchmark!
Claim 9: We heavily pipelined requests from clients to SpacetimeDB but did not pipeline requests to other databases.
“AFAICT the spacetime requests are heavily pipelined vs the Postgres options.” – Ben Dicken, Head of Developer Education at PlanetScale
“SpacetimeDB sets maxInflightPerWorker to 1 for the SQLite connector. But they set it to 16,384 for their own benchmark.” – Tanay Karnik
SpacetimeDB is capable of connecting to many thousands of clients simultaneously with no modifications. This benchmark is meant to simulate thousands of clients making individual requests to your backend, as you would expect in a real-world situation. The purpose of pipelining is to simulate the throughput of many thousands of clients without your laptop needing to make many thousands of connections to SpacetimeDB when you reproduce the benchmark on your own machine.
Several people pointed out that, in our original benchmark, the benchmark harness allowed the SpacetimeDB clients to "pipeline" up to 16,384 requests, whereas the competitors did not allow for such pipelining. The purpose of this was not to handicap our competitors, it was to be charitable to them. You want pipelining? Alright, you got it.
Let's run an α=0 (uncontended) benchmark with the following configuration parameters:
| Backend | Clients | Pipelining | Drizzle pool | DB max_connections | DB worker procs |
|---|---|---|---|---|---|
| Node.js + SQLite | 64 | 40 | N/A | N/A | N/A |
| Node.js + Supabase | 64 | 40 | 64 | 100 | 8 |
| Bun + Postgres | 64 | 40 | 64 | 100 | 8 |
| Node.js + Postgres | 64 | 40 | 64 | 100 | 8 |
| Node.js + PlanetScale (SN) | 64 | 40 | 64 | 600 | 25 |
| Node.js + PlanetScale (HA) | 384 | 40 | 384 | 600 | 155 |
| Convex | 64 | 40 | N/A | N/A | N/A |
| Node.js + CockroachDB (5 node) | 320 | 40 | 320 | unlimited | N/A |
The only difference between our reported α=0 results and this test is that we're allowing clients to pipeline up to 40 requests for the competitor backends. Let's look at a side-by-side of the official no-pipelining results and the 40-deep pipelining results:
| Backend | TPS (no pipelining) | TPS (40-deep) | p50 (no pipelining, ms) | p50 (40-deep, ms) |
|---|---|---|---|---|
| Bun + Postgres | 10,730 | 10,184 | 5.66 | 250 |
| Node.js + Postgres | 9,905 | 9,166 | 6.16 | 277 |
| Node.js + Supabase | 7,362 | 8,875 | 6.68 | 284 |
| Node.js + PlanetScale (SN) | 4,535 | 4,324 | 13.8 | 589 |
| Node.js + PlanetScale (HA) | 4,275 | 3,355 | 89.1 | 4,354 |
| Node.js + CockroachDB | 4,253 | 4,250 | 71.0 | 3,030 |
| Node.js + SQLite | 3,122 | 2,978 | 19.3 | 722 |
| Convex | 1,140 | 1,154 | 53.7 | 2,120 |
And here's the same data over time:
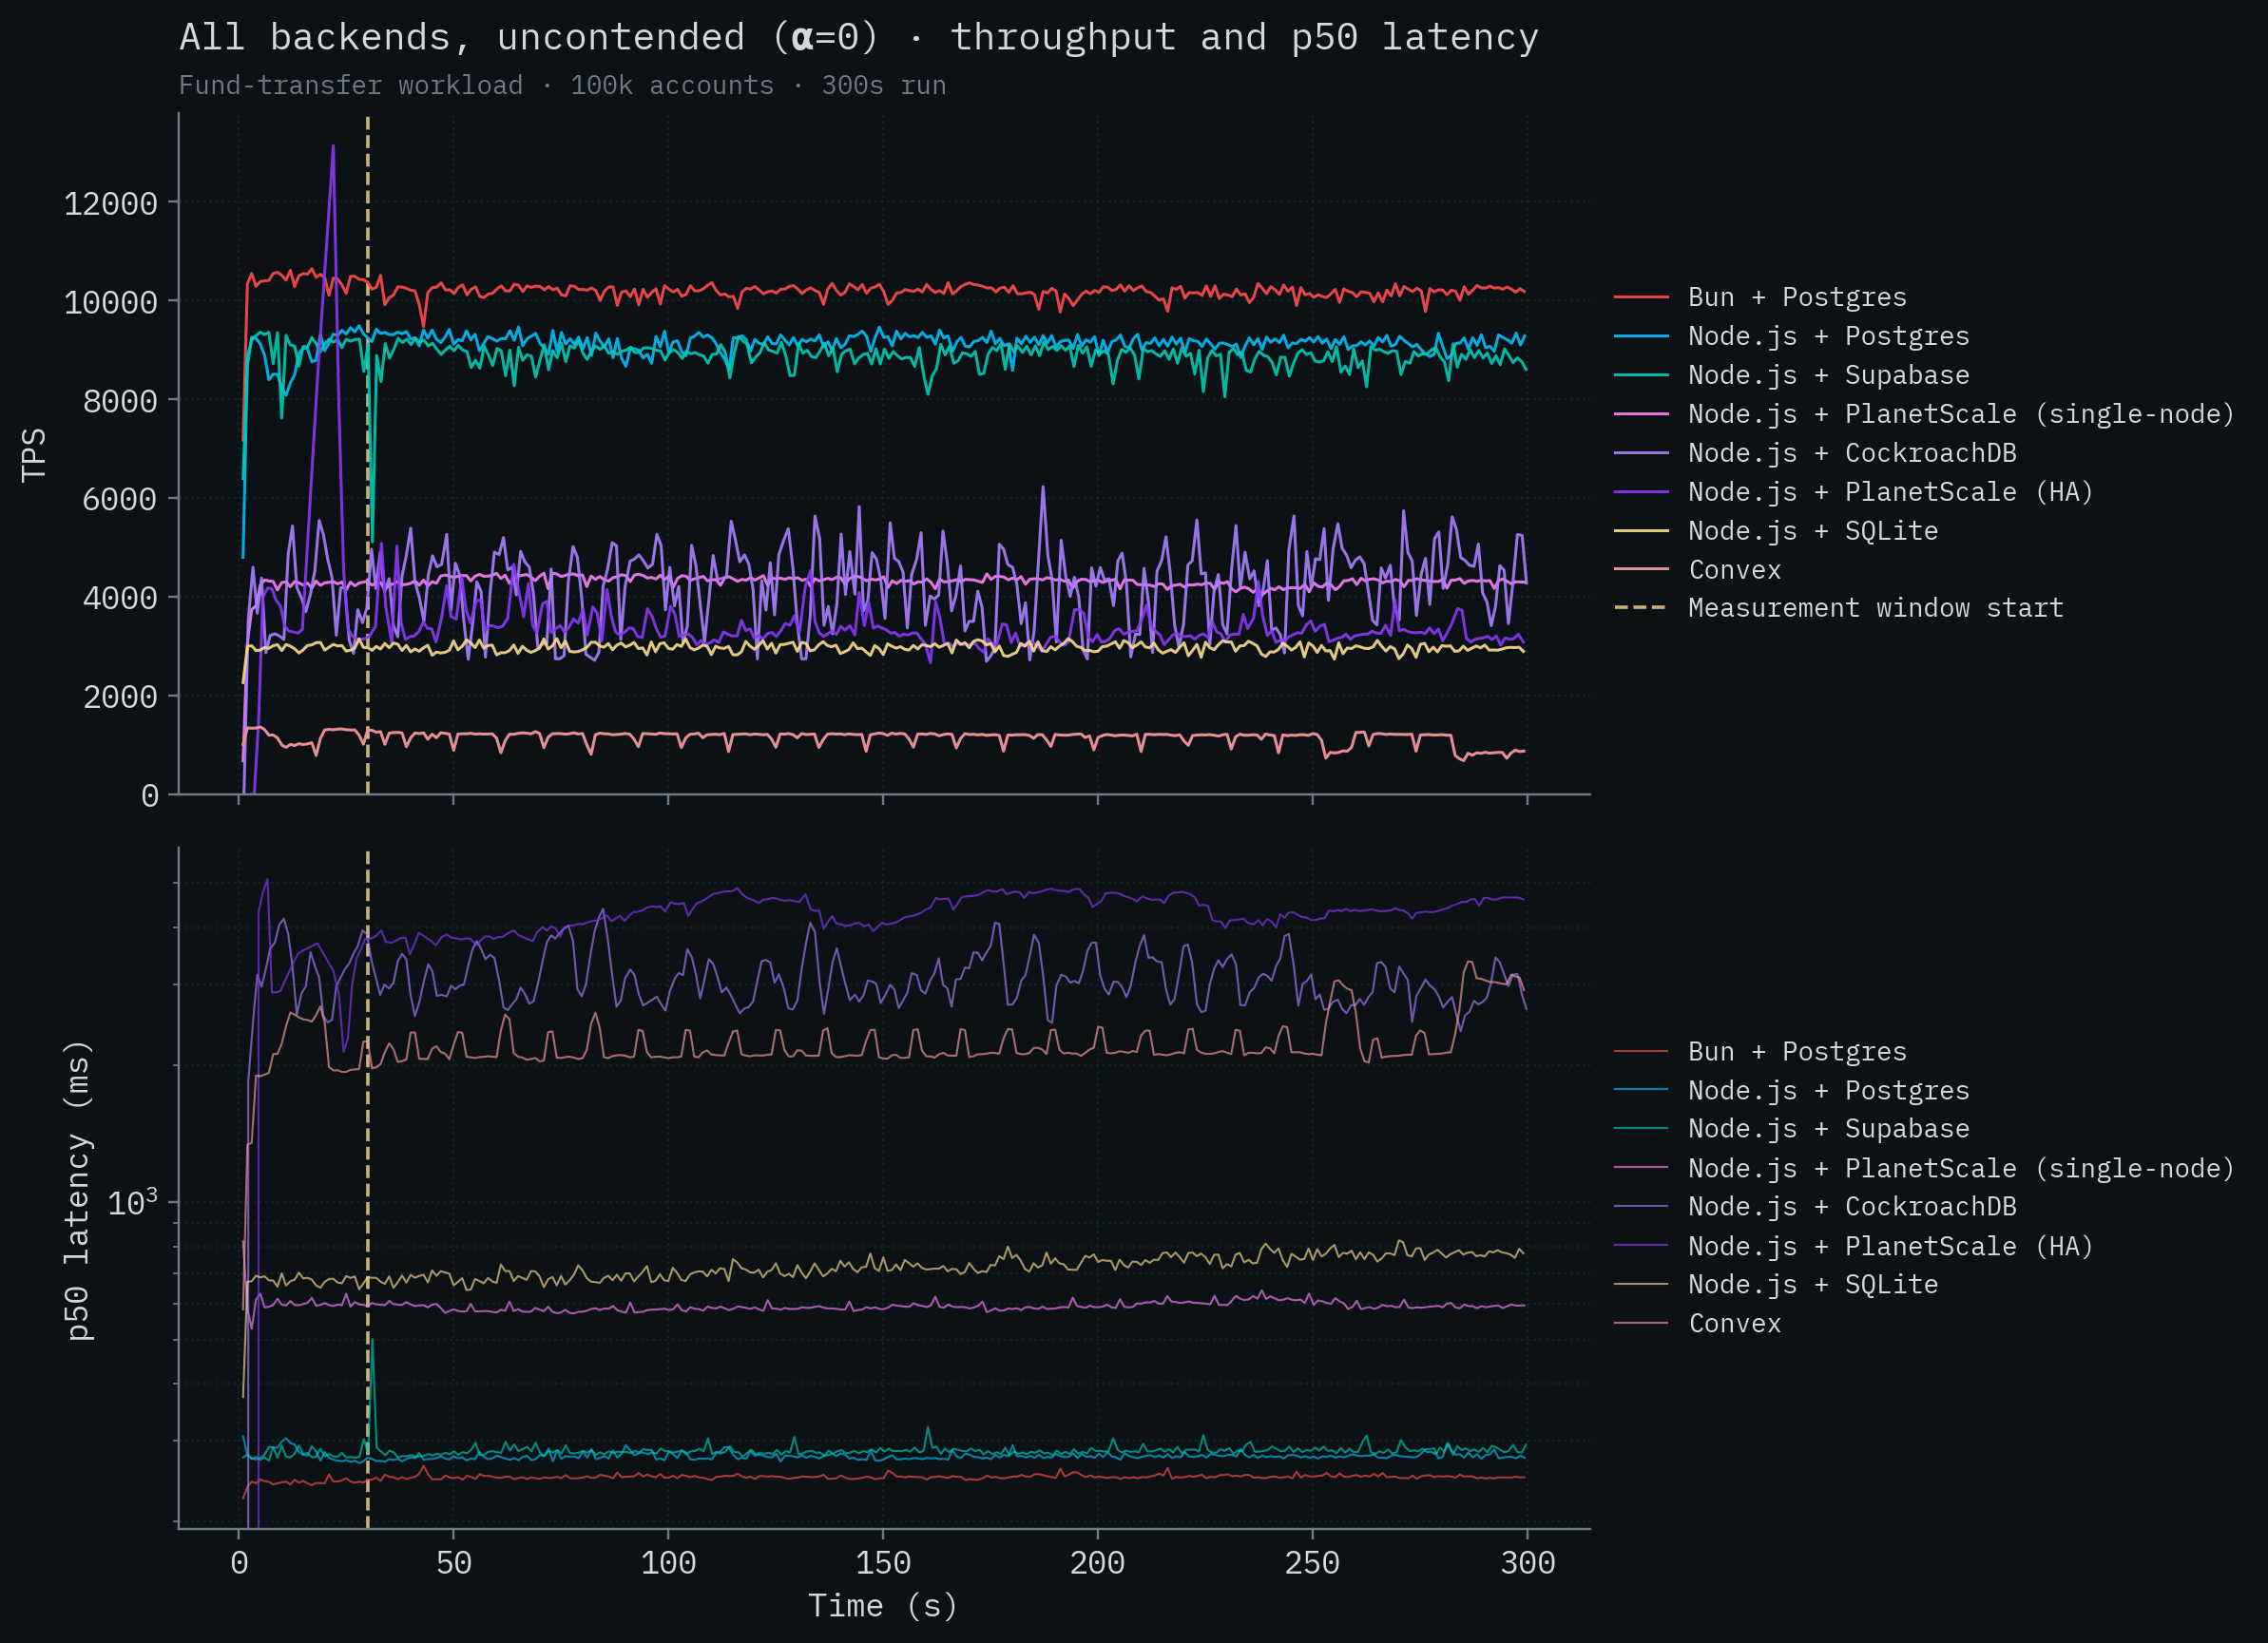
Note that the throughput for all of the competitor backends is essentially unchanged (most move within a few percent in either direction) but the latency for each of them has exploded. This is the latency that your users would experience if you had 2,560 of them submitting concurrent requests.

Why is the latency so high? Clients are submitting thousands of requests simultaneously and these backends can't handle the throughput, so the requests are just being queued up on the server and waiting to be run by the database. How do we know this for sure? Well, we can simply calculate the expected latency based on the number of requests clients can submit simultaneously and the throughput of the backend with this formula:
mean_latency = requests_in_flight / throughput You can see that the measured numbers match almost exactly this formula:
| Backend | Requests in flight | Throughput (TPS) | Computed mean (ms) | Measured p50 (ms) |
|---|---|---|---|---|
| Bun + Postgres | 2,560 | 10,184 | 251 | 250 |
| Node.js + Postgres | 2,560 | 9,166 | 279 | 277 |
| Node.js + Supabase | 2,560 | 8,875 | 288 | 284 |
| Node.js + PlanetScale (SN) | 2,560 | 4,324 | 592 | 589 |
| Node.js + PlanetScale (HA) | 15,360 | 3,355 | 4,578 | 4,354 |
| Node.js + CockroachDB | 12,800 | 4,250 | 3,012 | 3,030 |
| Node.js + SQLite | 2,560 | 2,978 | 859 | 722 |
| Convex | 2,560 | 1,154 | 2,218 | 2,120 |
(Inflight = N clients × 40-deep pipelining. PlanetScale HA uses 384 clients, CockroachDB uses 320 clients, the rest use 64.)
This relationship is very well illustrated in this post from Sunny Bains at TiDB. Once you reach maximum throughput, your latency begins to explode.
Keep in mind, this is for low contention tests. For high contention tests, we run into a similar problem just at a much lower ceiling because the bottleneck is waiting on locks that are held open due to server <-> database latency, rather than exhausting parallelism in Postgres. You can test it yourself. PlanetScale gets roughly 300 transactions per second on their $67,349 / month cluster whether clients are allowed to have 1 transaction pipelined or 40. Makes no measurable difference at all. This may seem shocking, but it's exactly what we would expect with the Postgres architecture under contention.
This is not a PlanetScale problem. This is a problem that no Postgres provider can solve.
For example, when doing 1 request per second, we measured a total p50 transaction latency of ~5 milliseconds (from BEGIN to COMMIT). Based on this we can calculate what the maximum theoretical throughput that Postgres could ever achieve on the $67,000 cluster, assuming zero contention in this configuration. The math is just Little's Law:
TPS_max = max_concurrent_transactions / per_transaction_latency
TPS_max = 384 / 0.005
TPS_max = 76,800 TPS
In the PlanetScale Metal case, the measured performance fell substantially short of this theoretical maximum, but for the sake of argument assume they were able to achieve close to the theoretical number. $67k/month could still only theoretically get you 25% the throughput of SpacetimeDB!
This gets to the heart of the architectural advantage of SpacetimeDB. In a traditional stack, your application server and database are separate silos. Achieving any semblance of high throughput requires extra machinery (RPC layers, batched queries, connection pools, etc), huge machines (192 vCPUs), and constant concurrency tuning (max_worker_processes, max_connections). And if your workload changes, that invalidates all your tuning. No amount of cores can ever save you. SpacetimeDB's very design simply eliminates all of this. The point of our benchmark is that we don’t need any special tuning or "trick". It just go brrrr.
Claim 10: Our performance is reliant on warming up SpacetimeDB.
“What cache warming was done?” – Ben Dicken, Head of Developer Education at PlanetScale
In our original benchmark, we warmed up SpacetimeDB before running the benchmark. This was added as an experiment during the development of the benchmark, but had no impact on performance. This code has now just been removed with no impact on the results.
Additionally, all of our benchmarks now include an explicit 30 second warmup window, as shown in our timeseries graphs, before which the measurements are discarded and do not contribute to the throughput or latency calculations.
Claim 11: We didn’t specify which regions we ran in.
“What region was each database and client in?” – Ben Dicken, Head of Developer Education at PlanetScale
This one is fair enough. In the original benchmark, we accidentally left it out of our report in part because it’s only potentially relevant for two of the tests. CockroachDB was the only other clusterized database, so we chose to run the servers on separate machines in GCP in the same region and availability zone. PlanetScale was the only test we couldn’t run on our own hardware because they don’t have an open source, self-hosted solution, a fact we noted explicitly in the keynote and in our methodology.
For all other tests we colocated the database and server on the same machines to afford our competitors the absolute lowest possible network latency under ideal conditions, and so we implicitly ran the server and database in the same availability zone and, by extension, the same region. We should have called it out explicitly in our report.
For PlanetScale in particular, following their own benchmarking methodology, we ran our servers in the same GCP region as our PlanetScale database. PlanetScale’s UI does not allow you to set a particular AZ for the primary.
This time around we ran the PlanetScale tests in AWS, rather than GCP, just to demonstrate that the cloud provider didn't have a meaningful impact on throughput. As before, we ran the server in the same AWS region as our PlanetScale database.
I should also note that I spoke with Ben Dicken at PlanetScale regarding our benchmarks and he pointed out to me that cloud providers sometimes distinguish between physical and logical availability zones. In particular, in order to avoid users piling into a single availability zone (e.g. zone 1), cloud providers will map different customers to different availability zones under the hood to distribute the load. So in order to be scheduled to the same physical availability zone, you need to reroll where you’re scheduled until you are actually scheduled to the same availability zone as the primary database. I didn’t know this. As far as I can tell, this knowledge is not widespread; the cofounder of Convex also learned this recently.
We did not do this in our testing. We cannot choose which AZ the primary is scheduled to, and PlanetScale may move a primary in HA mode, so to minimize latency you’d be restricted to single node mode anyway. We don’t believe this is a common thing that users take into account when using a service like PlanetScale.
We have now updated our report to clarify that we ran the servers and databases in the same region/availability zone for all testing.
Claim 12: SQLite can achieve the same performance as SpacetimeDB with batching.
This issue was raised in the well written, and well reasoned blog post by Tanay Karnik. In this post, Tanay demonstrates that with batching 4000 requests, WAL mode enabled, and a custom RPC server, SQLite is capable of achieving 163,075 transactions per second using out-of-the-box Node.js and Drizzle ORM.
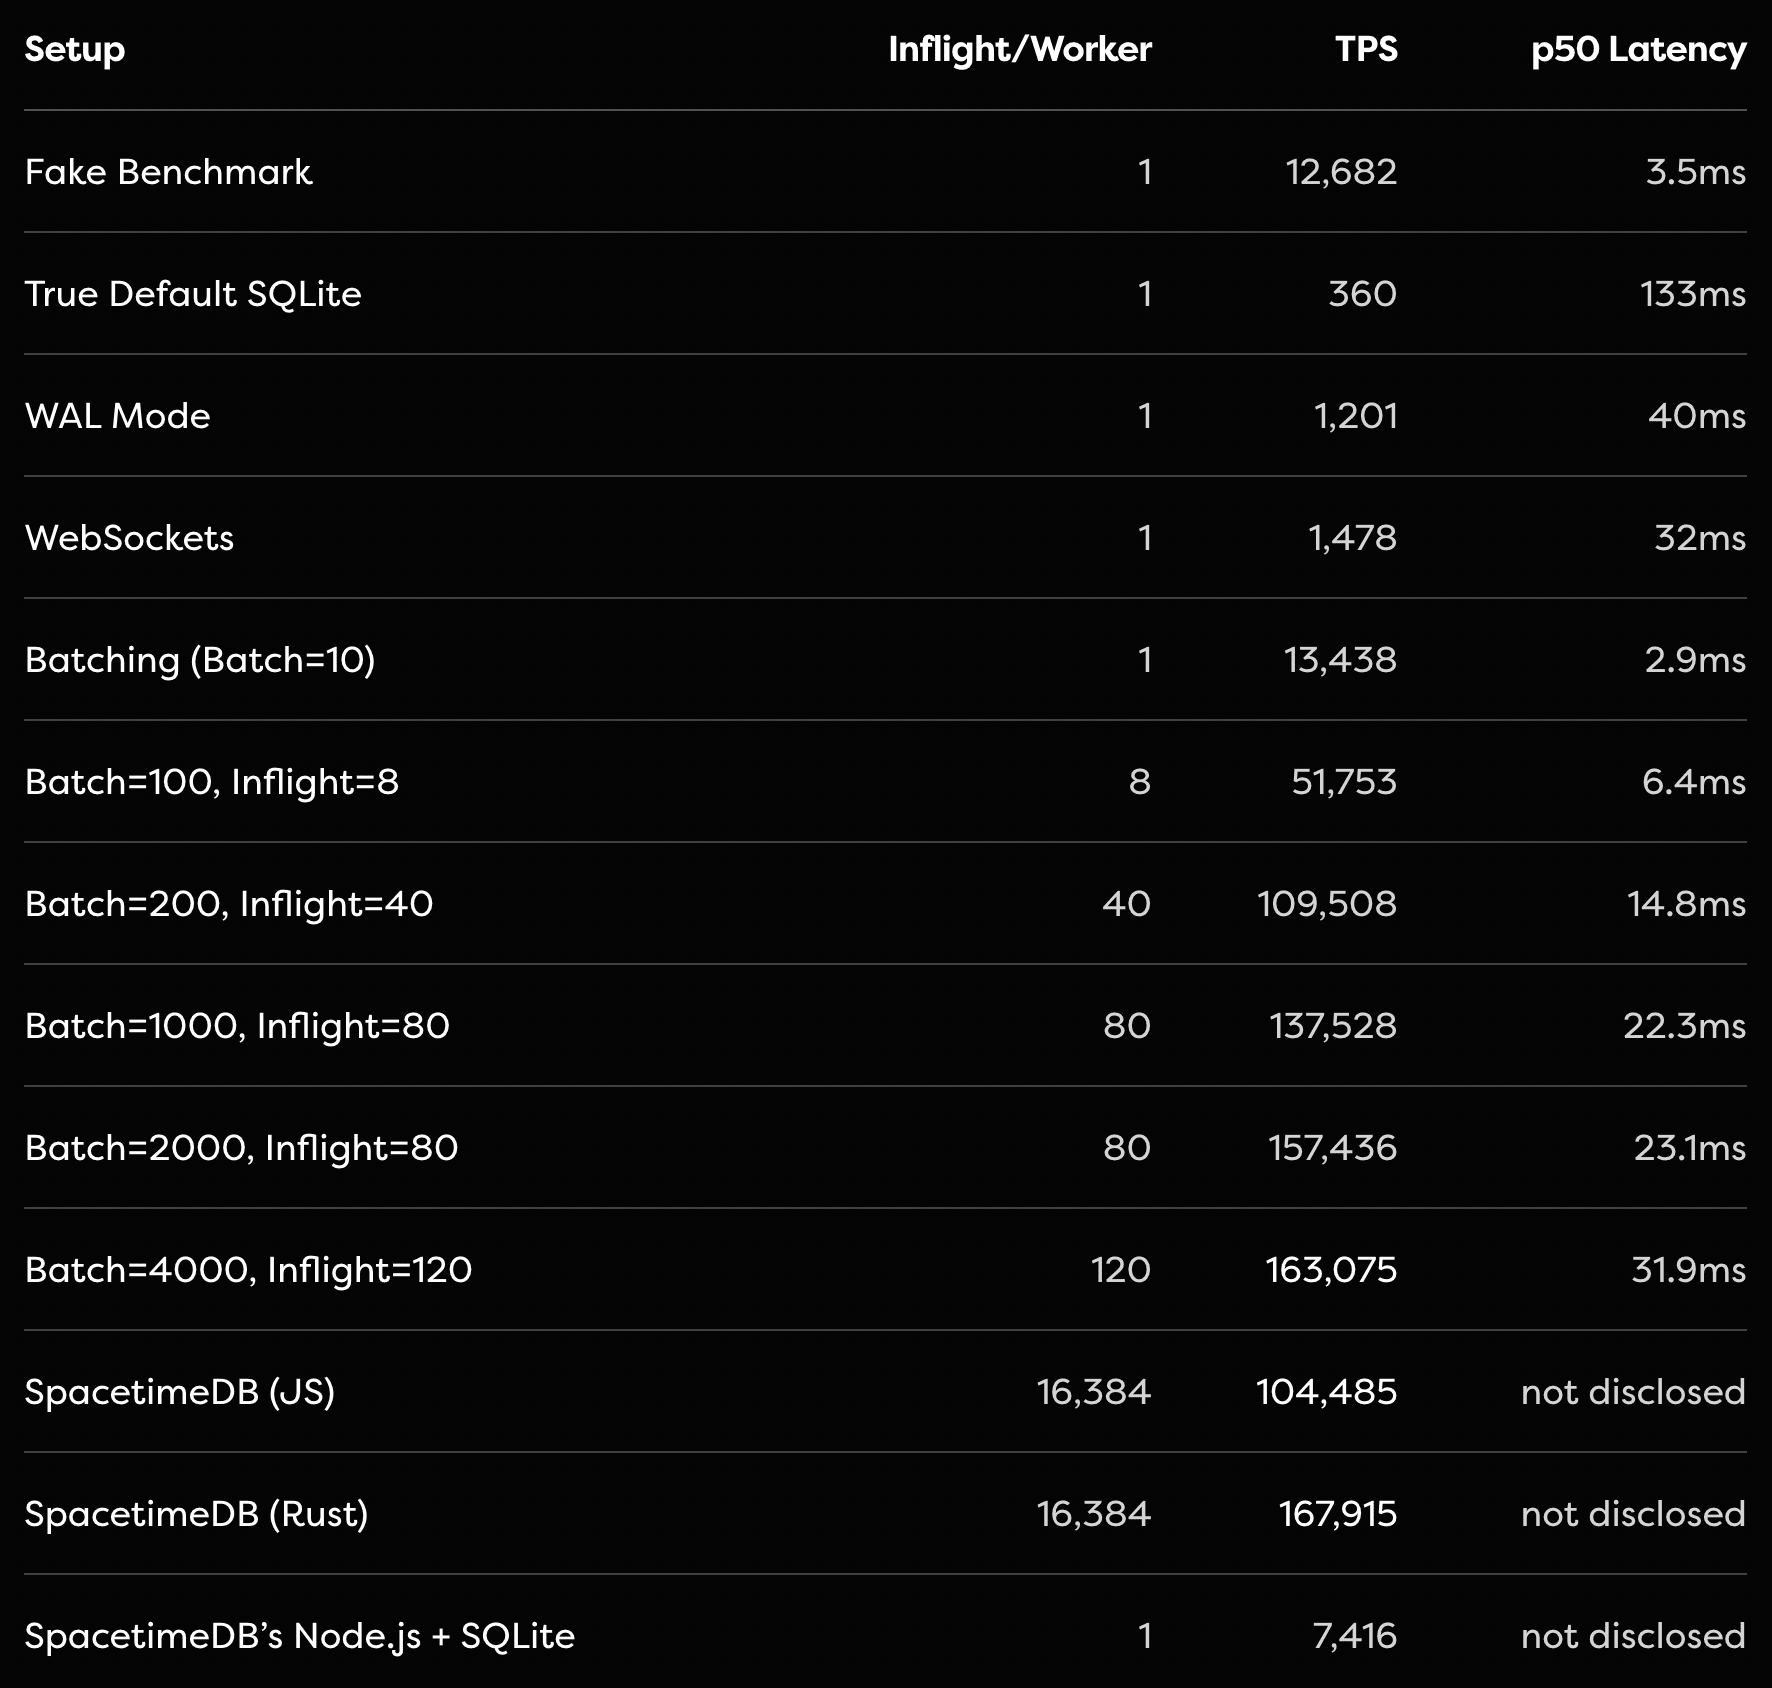
SQLite is an incredible piece of technology, and we would recommend it in most circumstances over a standard separate server and Postgres setup for performance reasons. Additionally, Tanay’s group-commit optimization is exactly what you’d want to do to make SQLite perform well. It’s a correct implementation of the benchmark as far as I can tell. All transactions will be processed in serial order and the same transfers that would have failed due to insufficient funds will still fail independently just like in SpacetimeDB.
That being said, we would make 2 points:
- Much like with stored procedures, although this performance is clearly achievable, it’s not commonly achieved. Most web developers do not write their own custom RPC, modify SQLite configuration, or batch requests to be sent to SQLite all at once. The batching here is non-trivial and you need to be cautious about the semantics of doing this in a single transaction. By contrast, you simply don’t need to do batching with SpacetimeDB’s API, you can just send requests from thousands of clients simultaneously and SpacetimeDB will process them to the tune of 300,000+ per second.
- SQLite is fantastic! You should use it! But keep in mind that SpacetimeDB offers much more than SQLite, including real-time incremental subscription evaluation, a code-first architecture, implicit transactions, and the ability to use the same types in your client, server, and database.
Claim 13: We weren’t actually executing SQLite statements in one of our tests.
“The update statements are never RUN.” – Tanay Karnik
This one is a bit embarrassing. As Tanay points out in his blog, in the final benchmark we published for SQLite we weren’t actually testing SQLite at all because the queries never executed, so we were essentially benchmarking just Node.js. Yikes.
We have since fixed this and updated the results. As Tanay found, without further batching and configuration optimization the results are worse.
Final thoughts
Benchmark methodology matters. Benchmarks matter. And most importantly performance matters.
Don’t let the excuse parade from competitors, who spent almost no effort to understand SpacetimeDB’s architecture, handwave results like this away. 1000x wins are possible. Try as they might, no amount of nitpicking or error bars by our competitors can turn 200 TPS into 300,000 TPS.
The keynote presentation has shown that the biggest challenge we face in demonstrating the speed of SpacetimeDB is that people think we must be cheating. They simply don’t believe an improvement like that is possible. We would almost be better off throttling SpacetimeDB in order to make the numbers seem more believable.
I’d like to be clear. We are not claiming that Postgres would be 1000x faster if they were just better programmers. We’re claiming that the server <-> database architecture that we’ve all come to accept is fundamentally flawed and limited by the speed of light. This is a fact that no database provider can escape, unless they run your server in-process.
If you take nothing else away from this post, take this:
Our benchmark is a sensible and honest benchmark that reflects the performance and scalability you can expect to experience for web applications generally. Within 10 minutes of using SpacetimeDB, it will fundamentally change your idea of what databases are capable of. That I can guarantee.
All the handwringing about how you can twist Postgres and SQLite to get close to SpacetimeDB performance proves the point. Don’t take it from me. Take it from Tanay. Take it from Johnathan. Performance is clearly being left on the table.
Will you pick it up?
Tyler Cloutier
Cofounder, Clockwork Labs
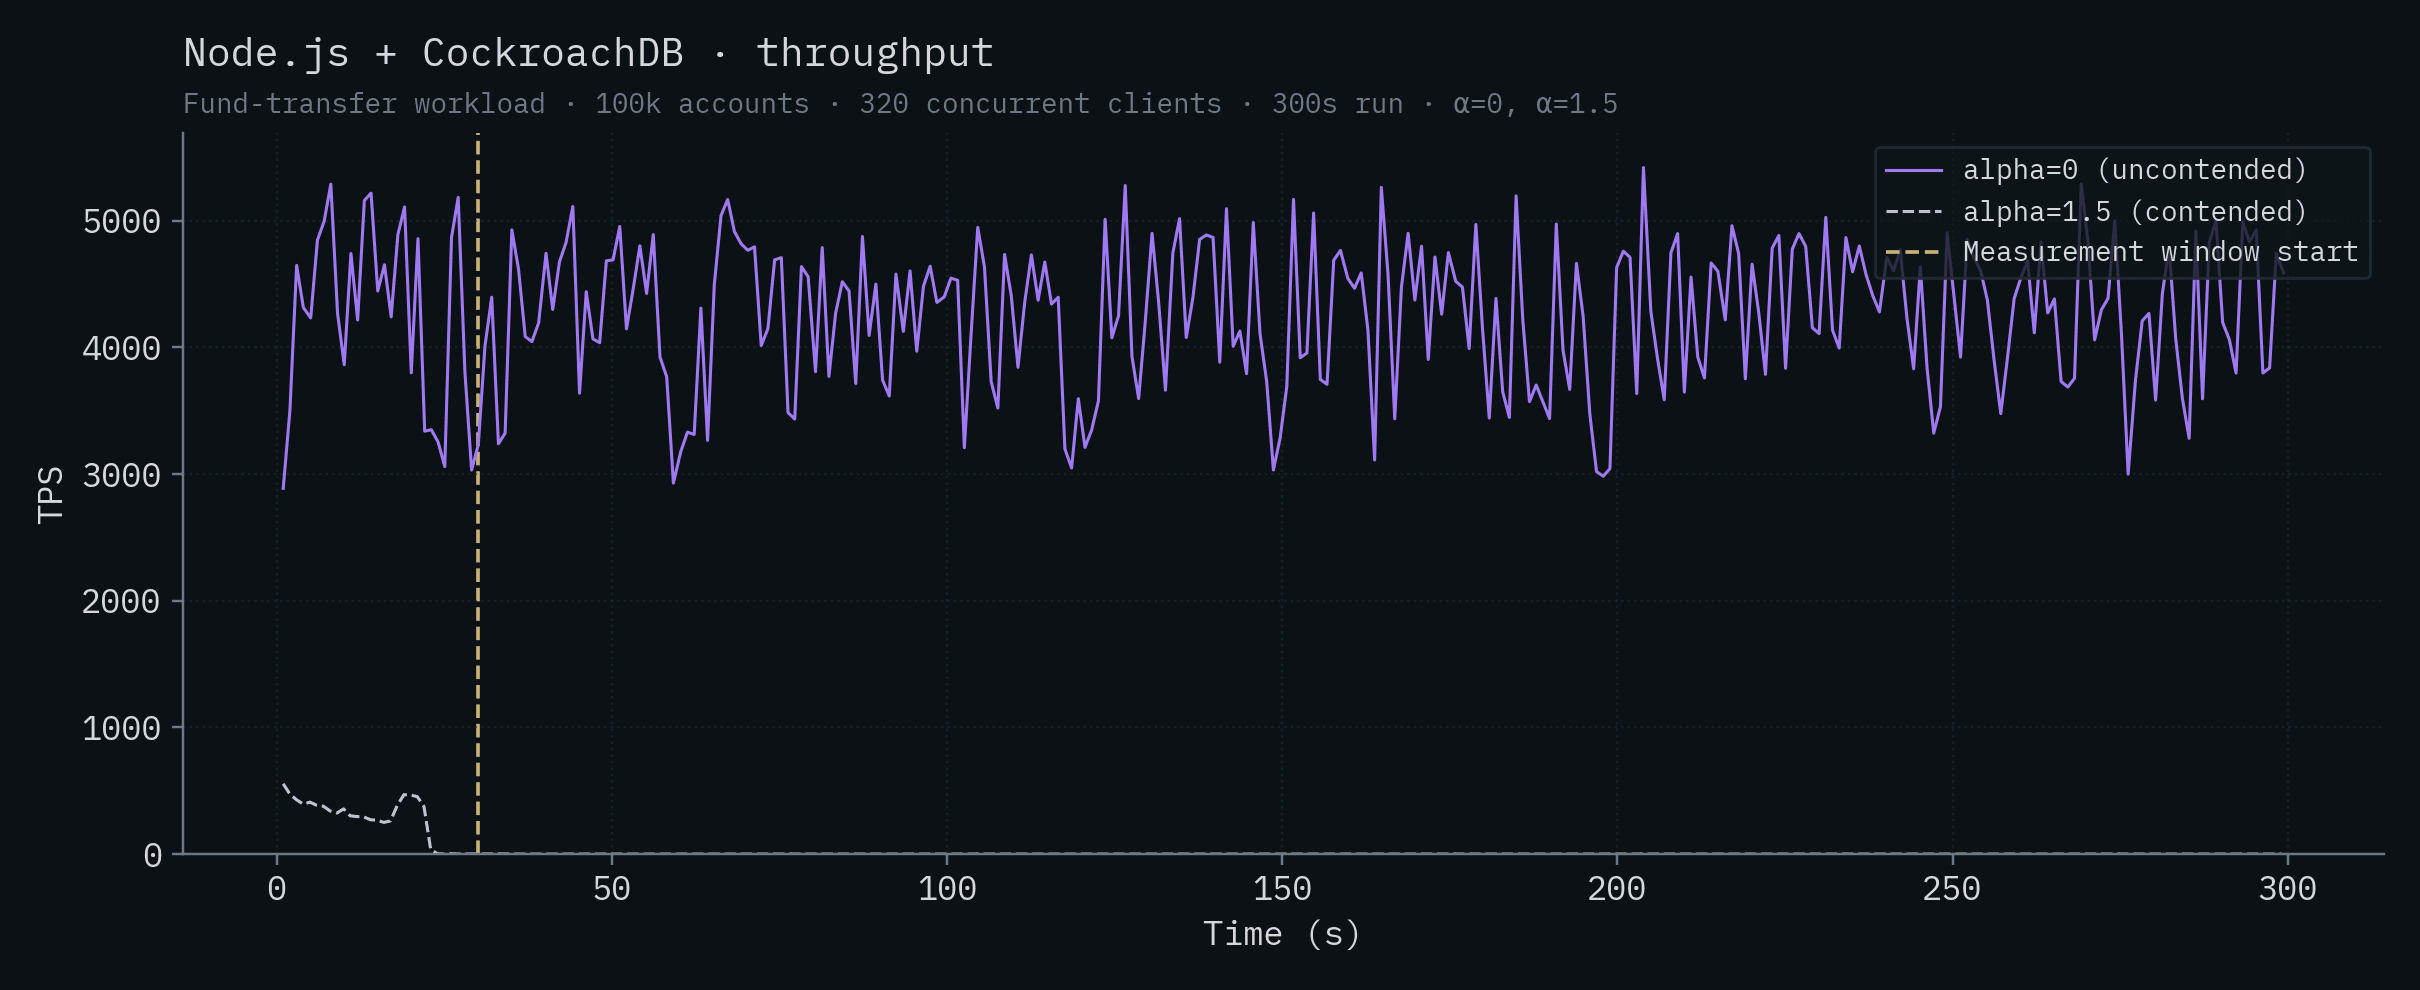
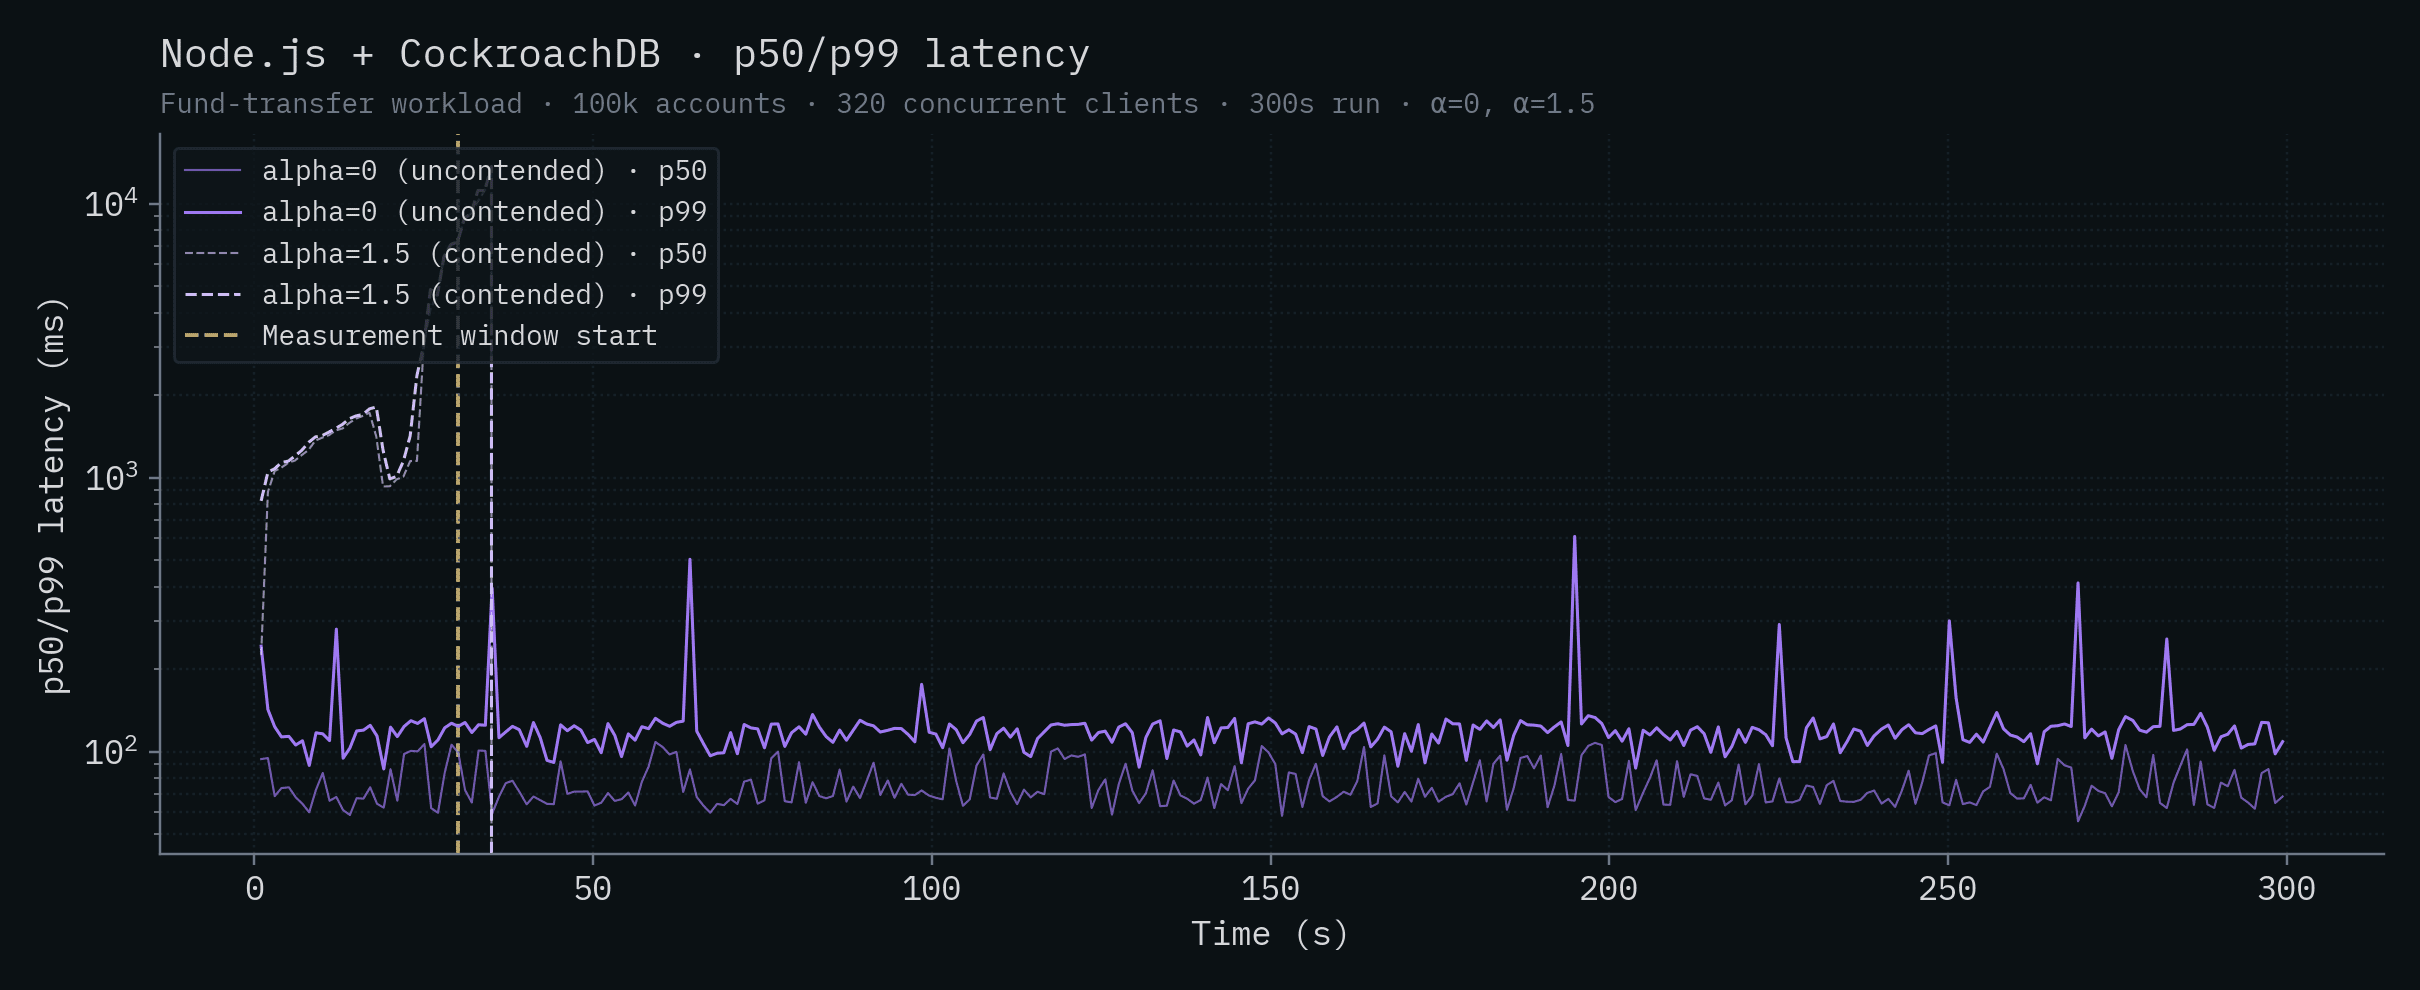
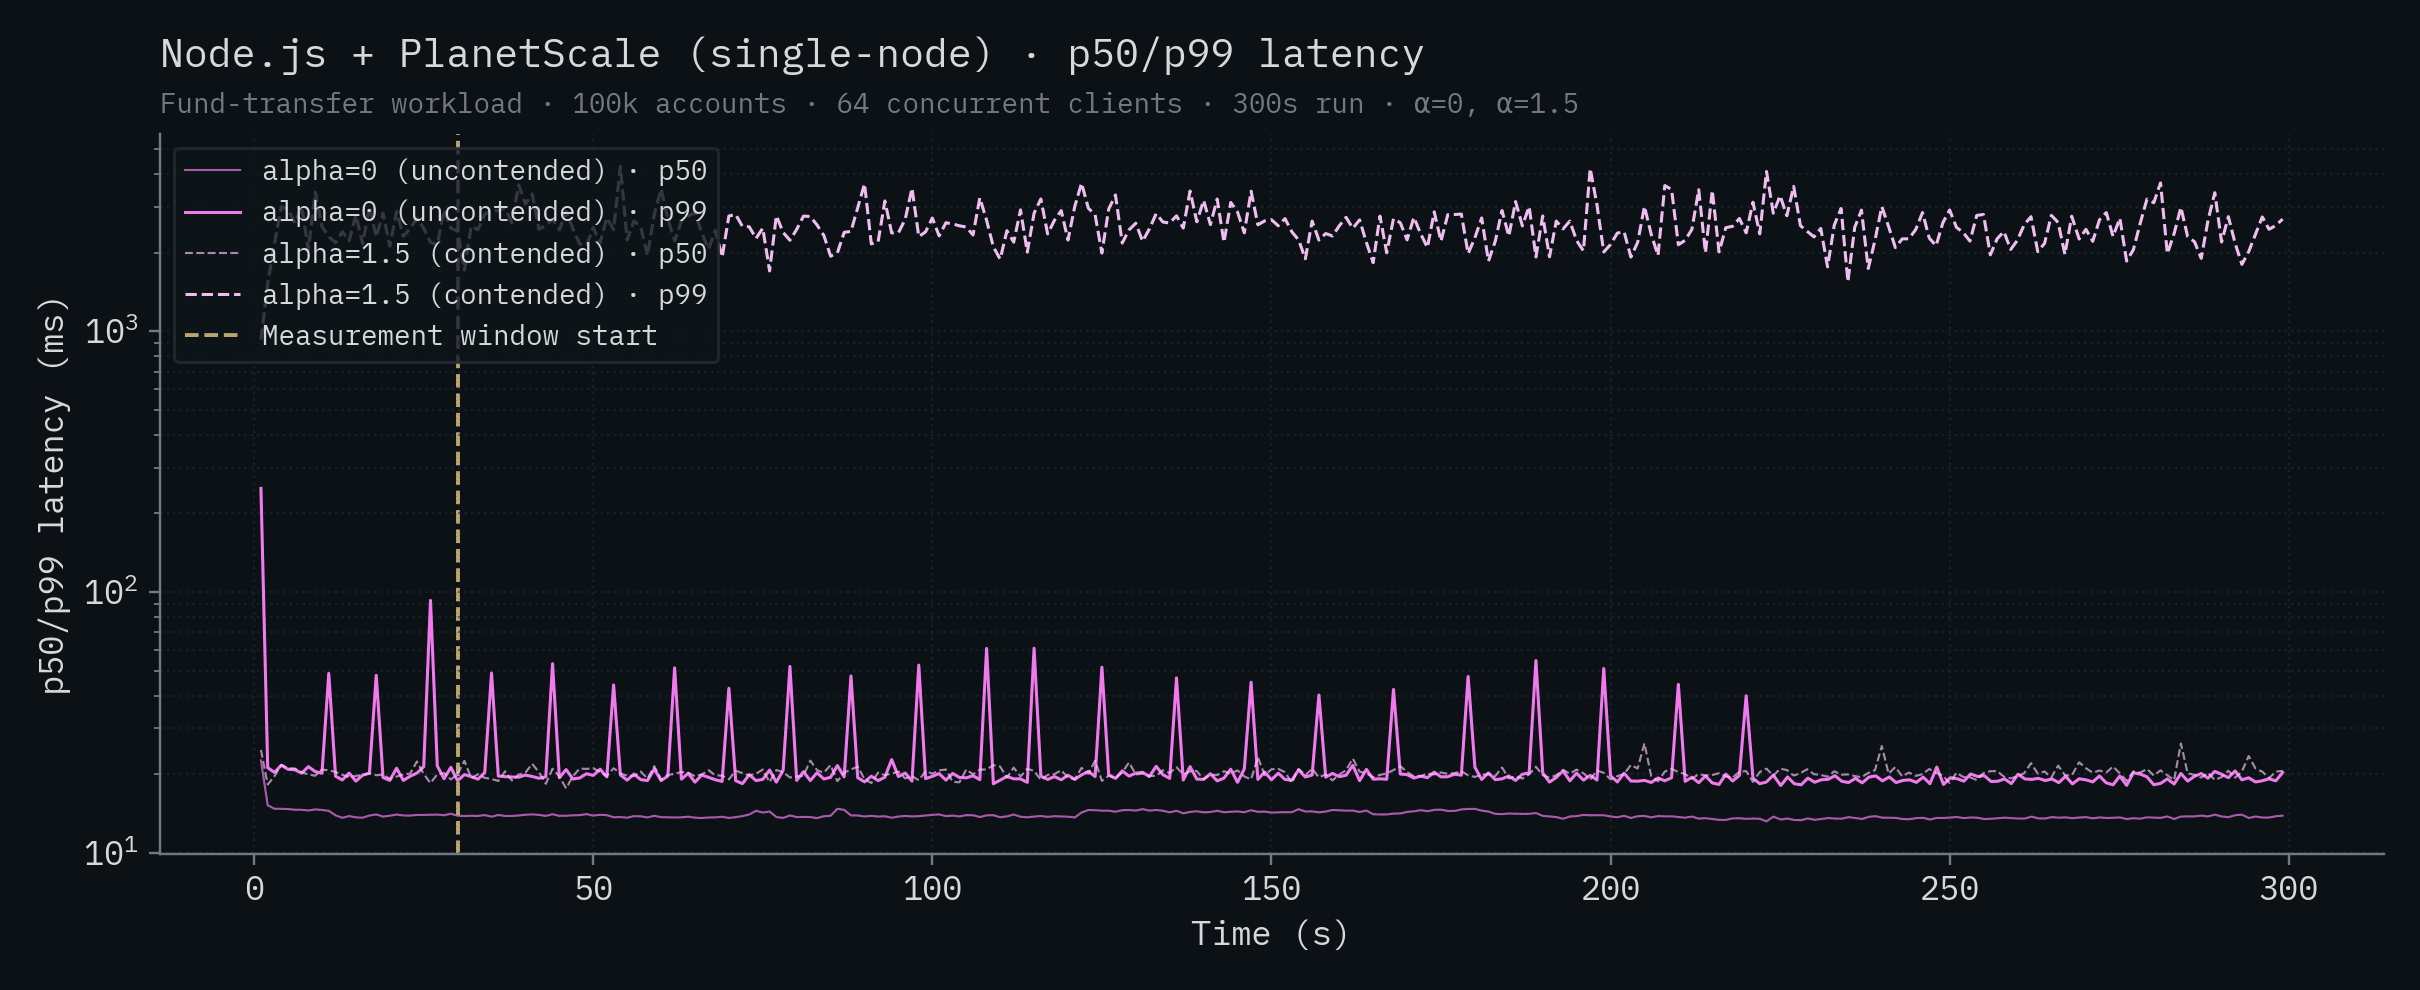
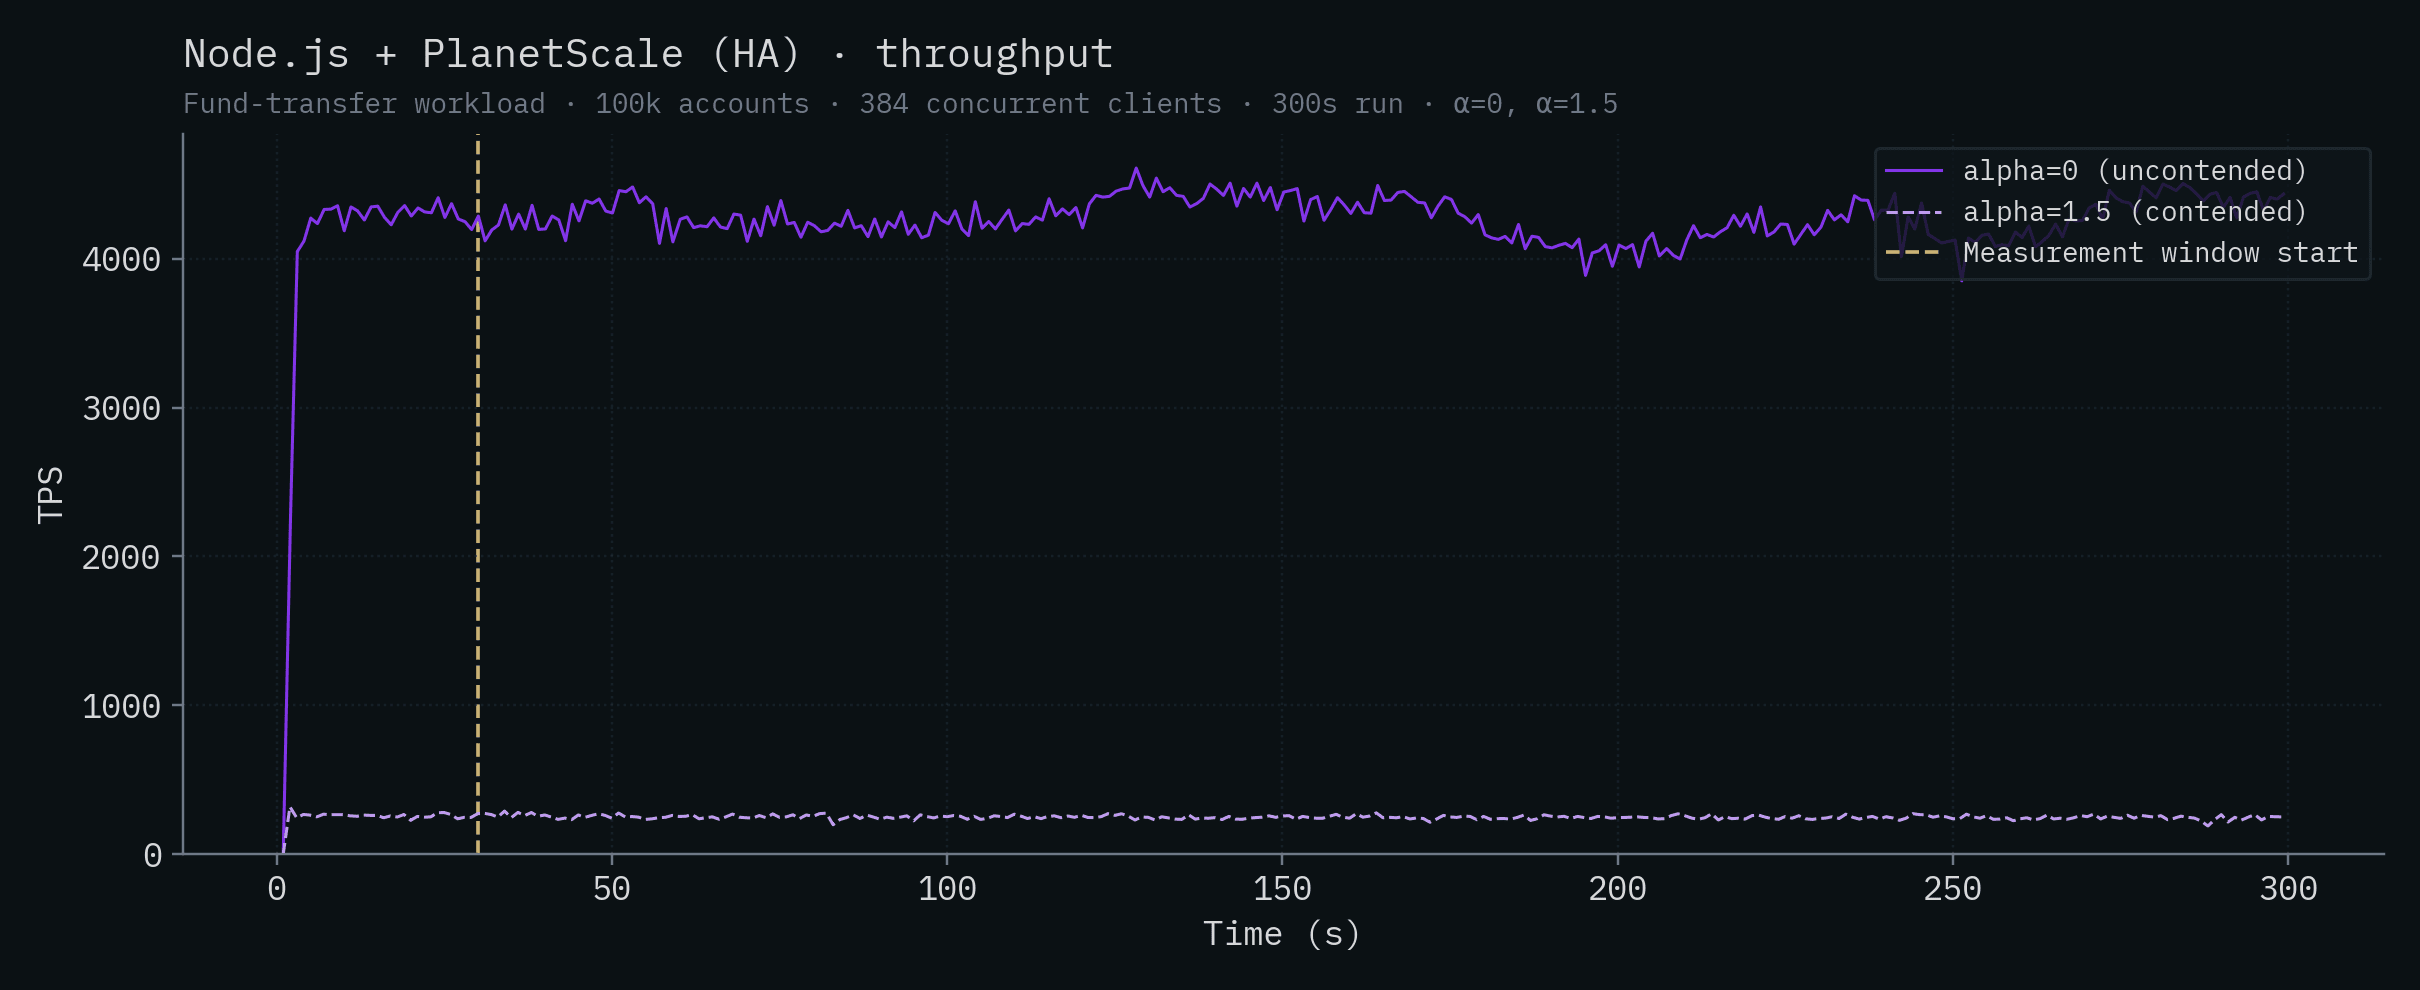
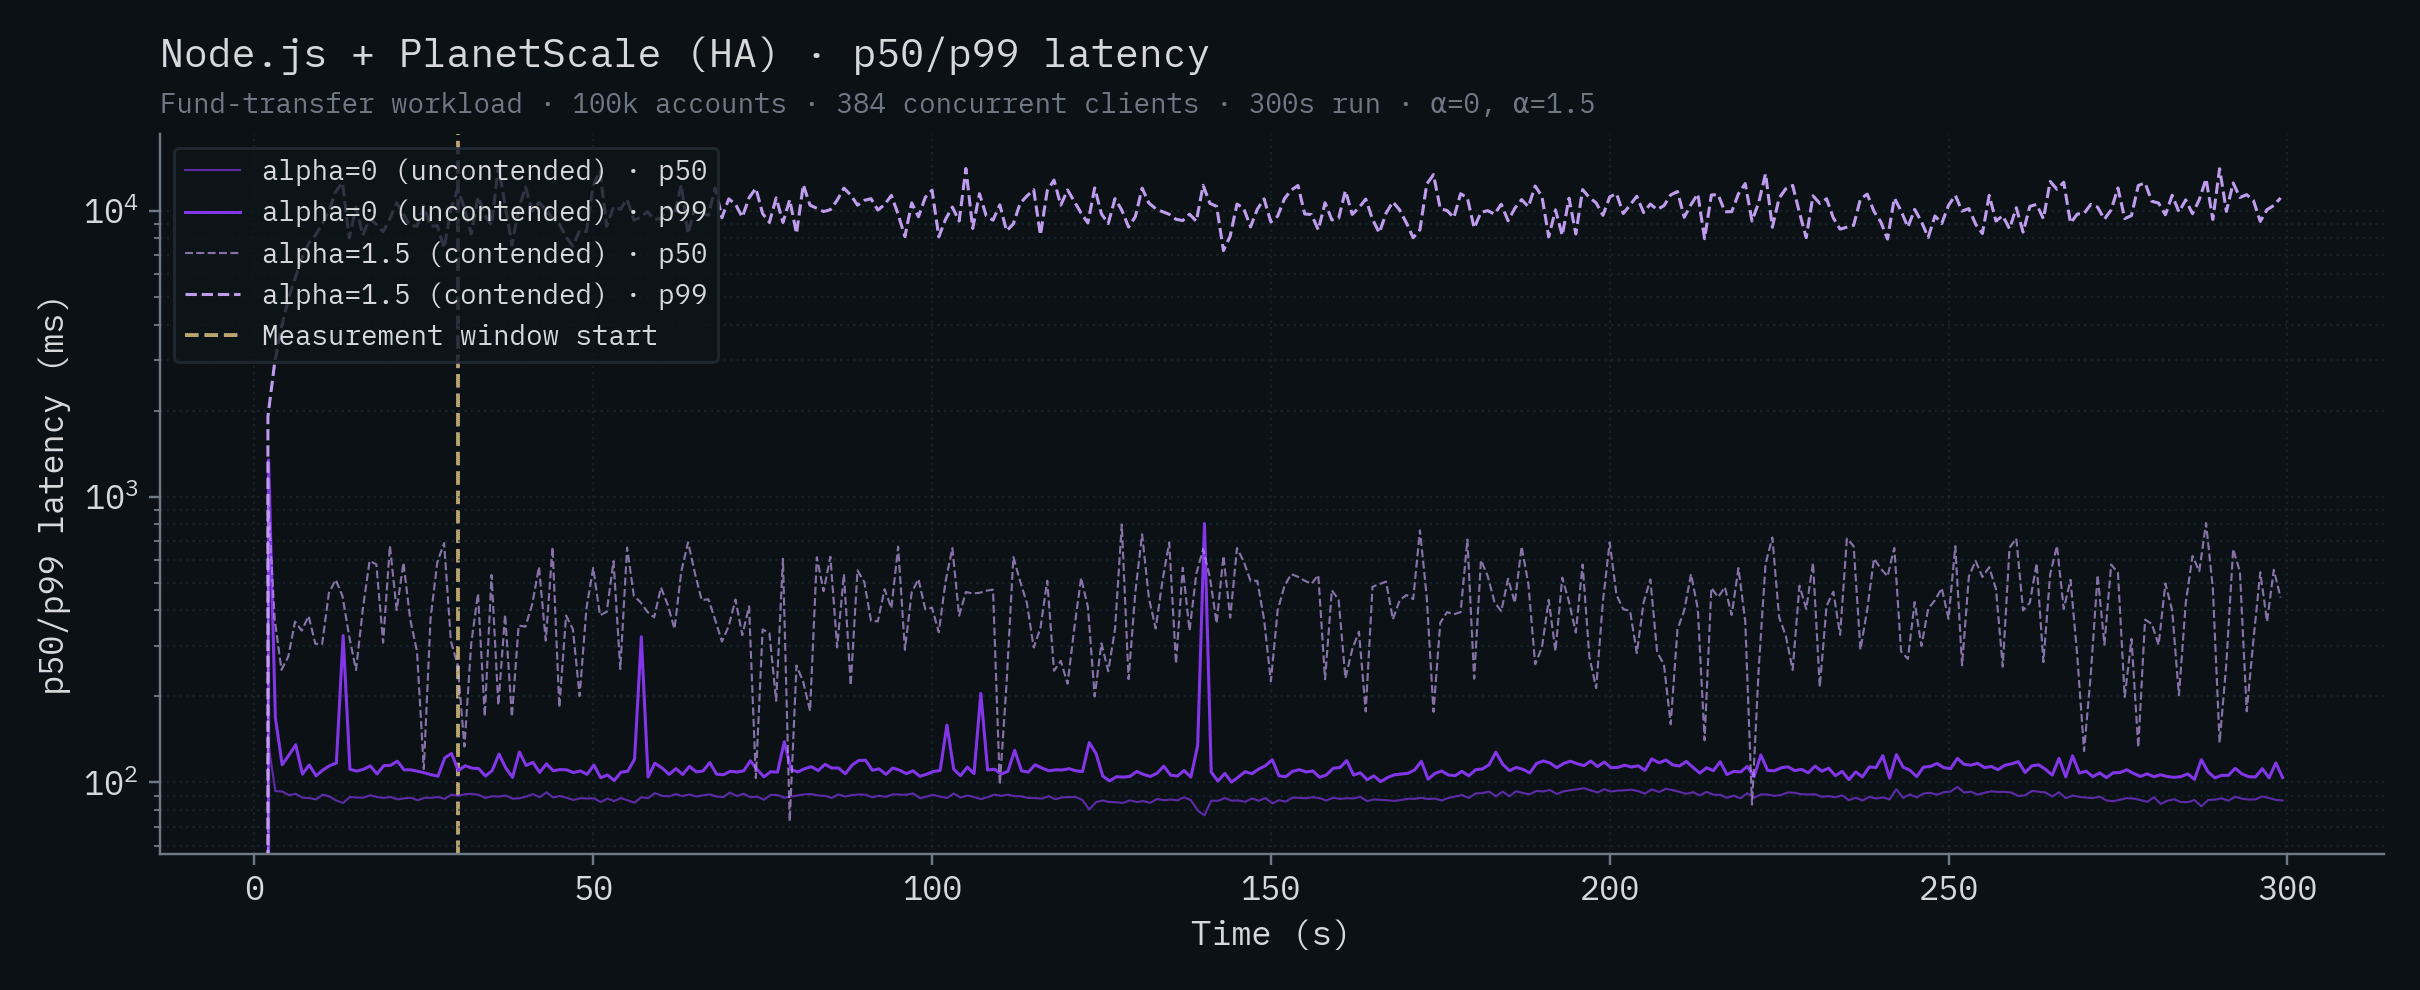
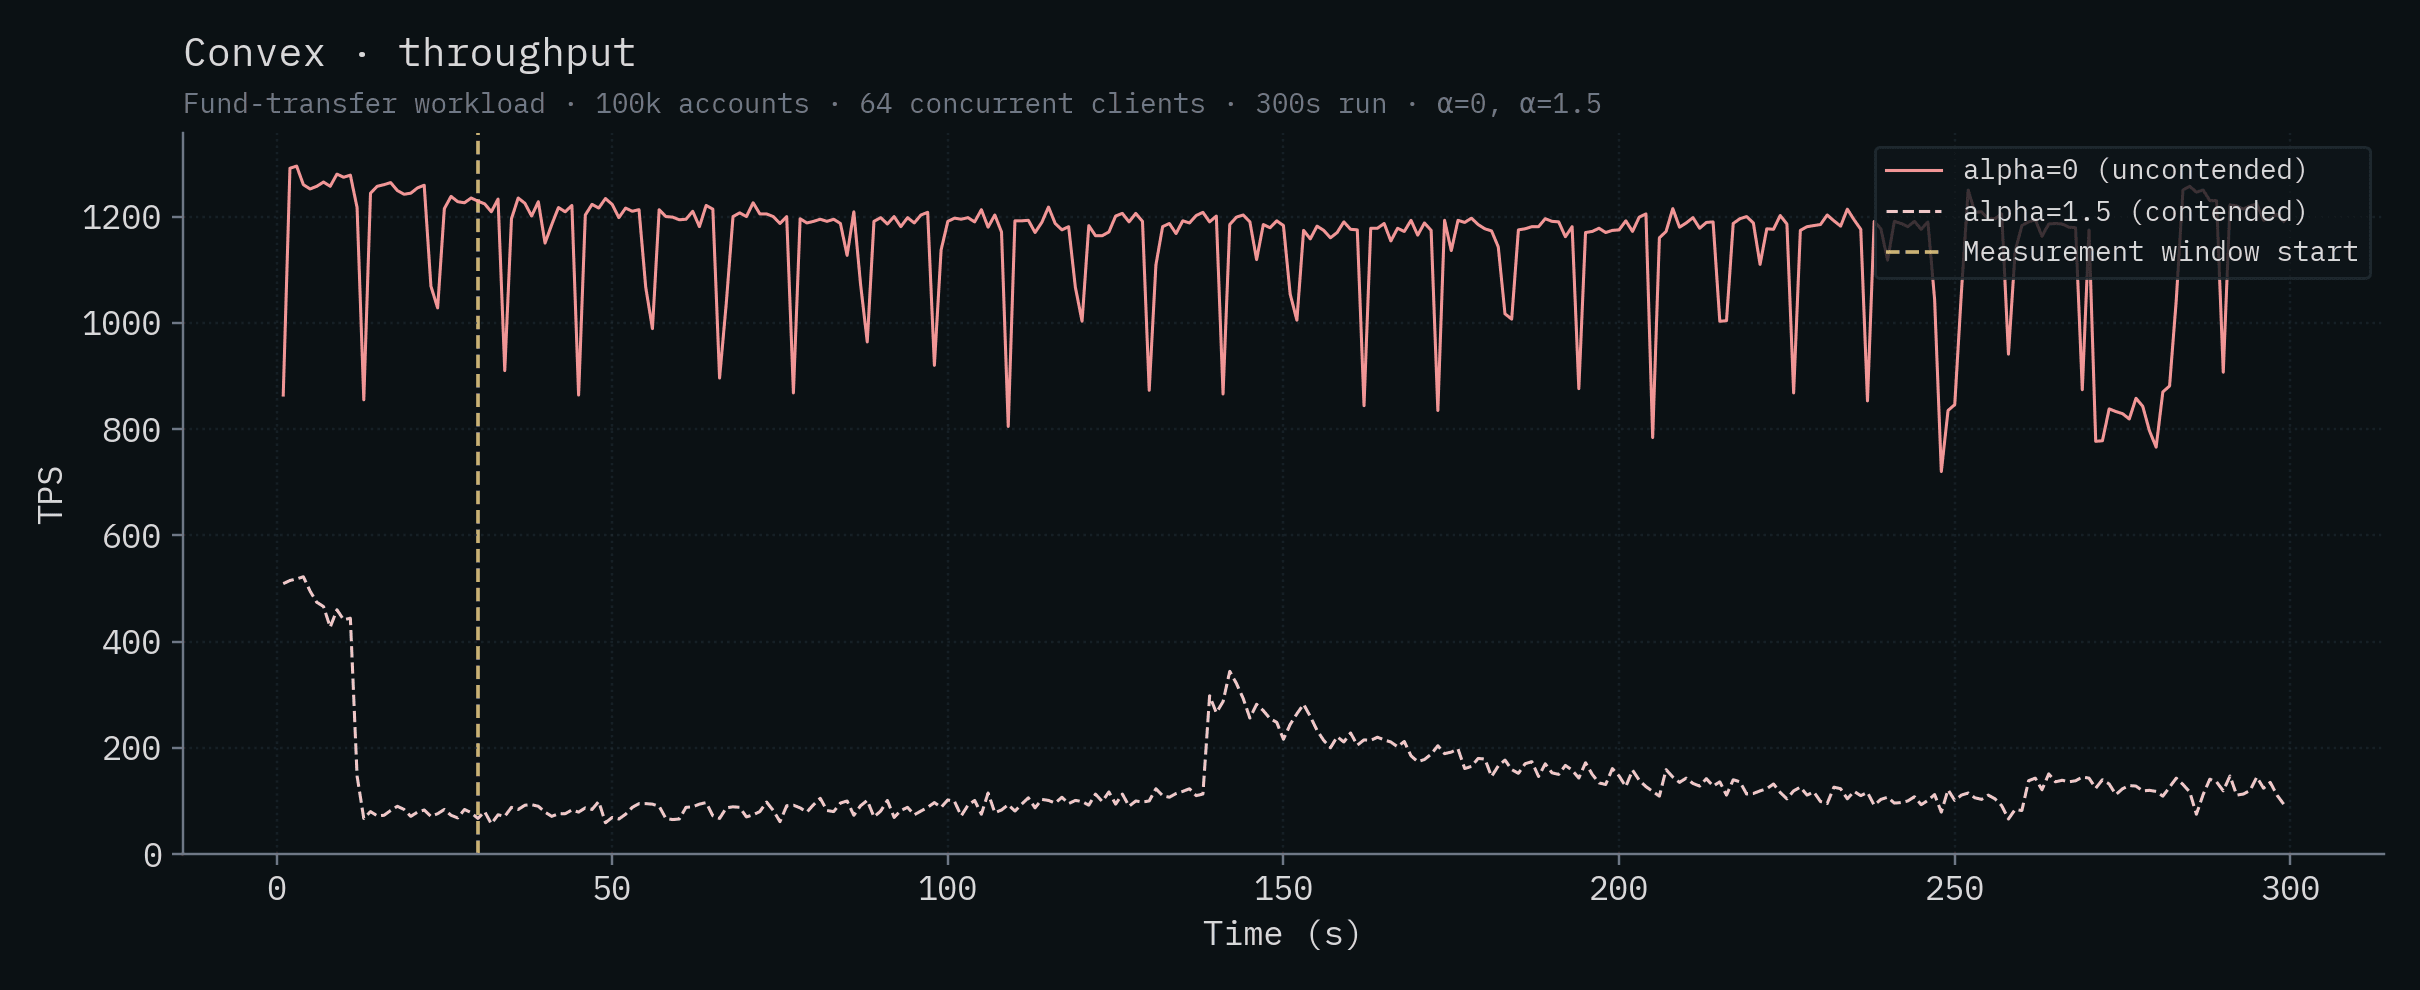
Appendix: per-backend charts
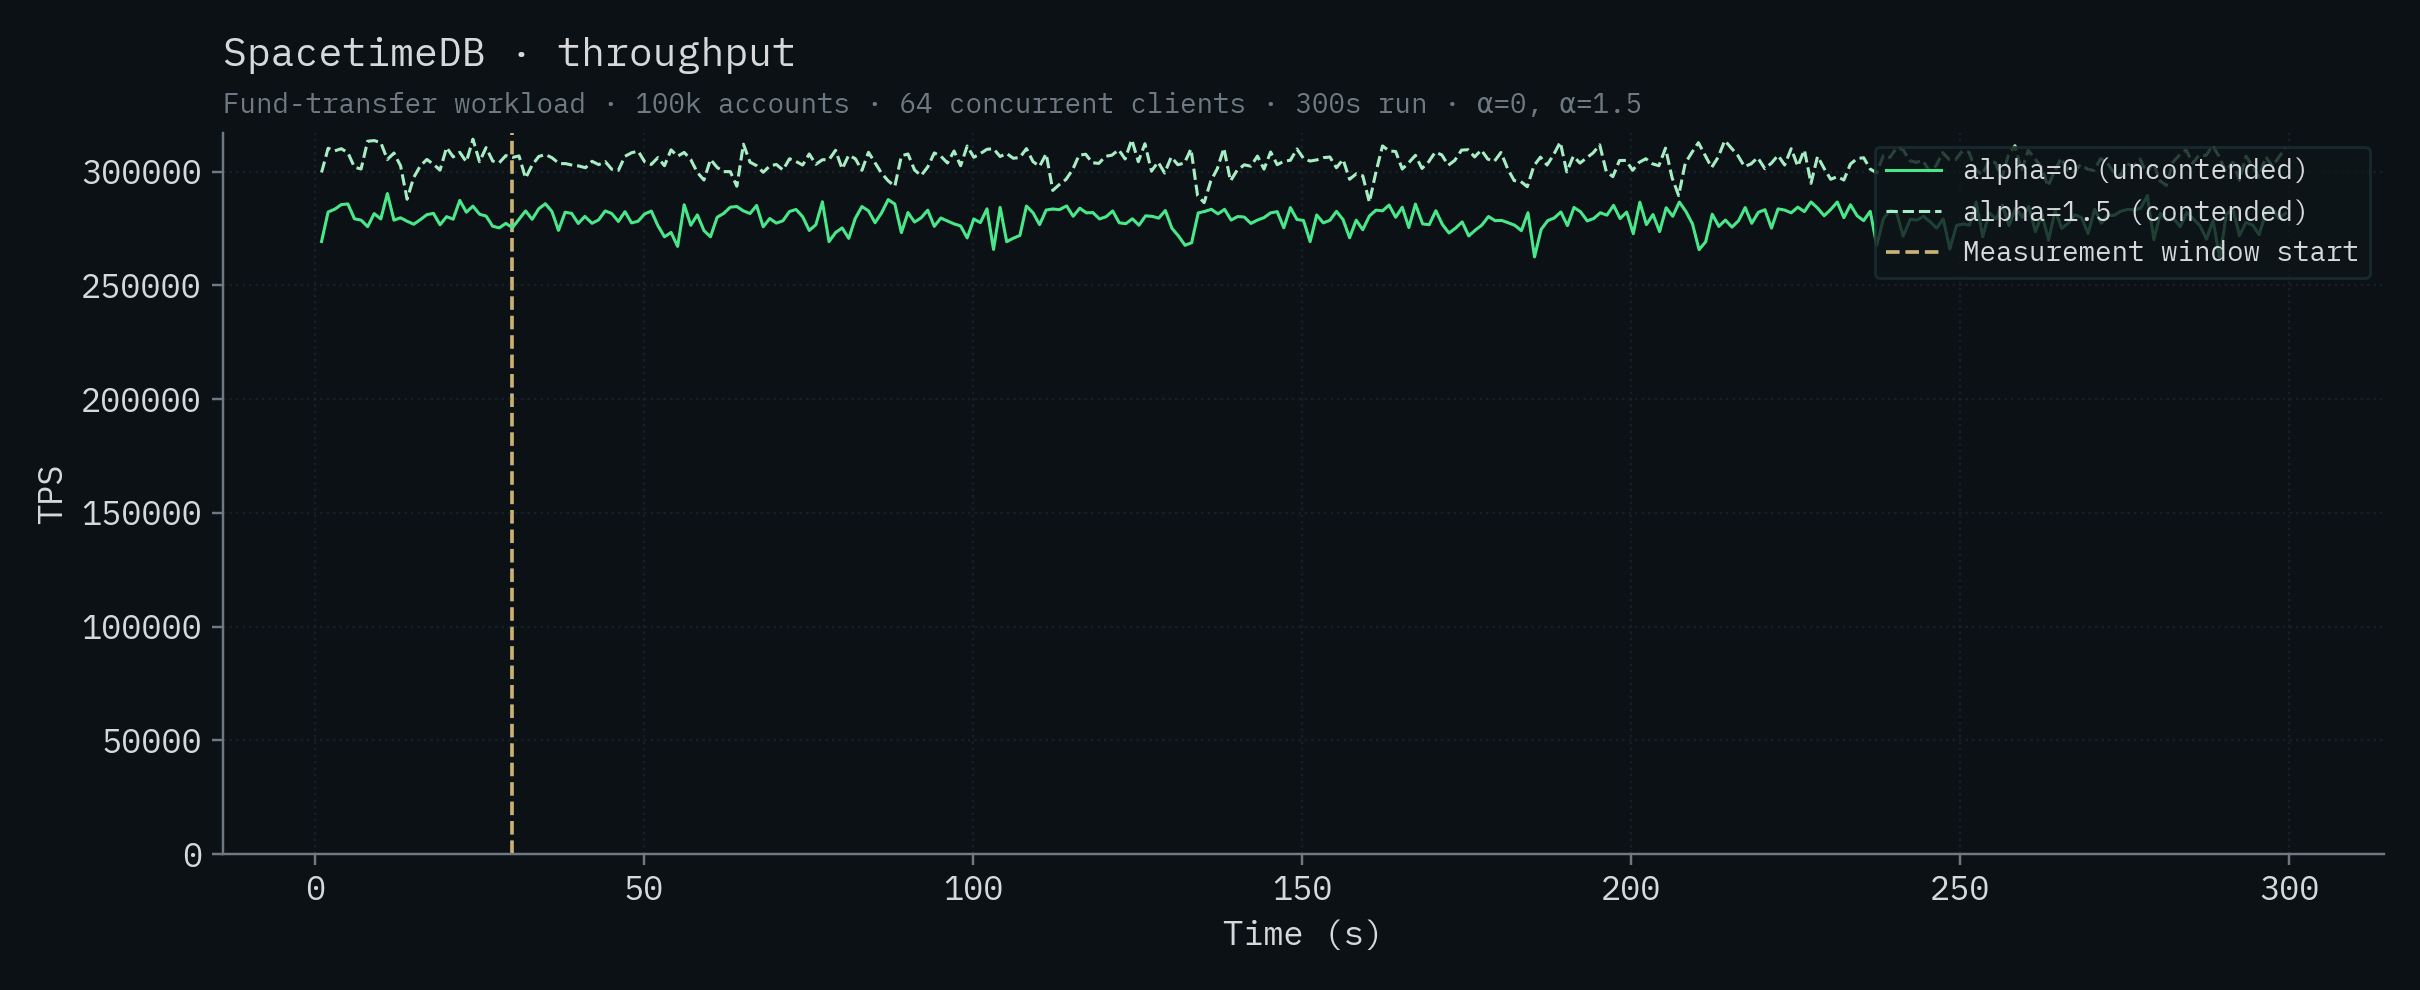
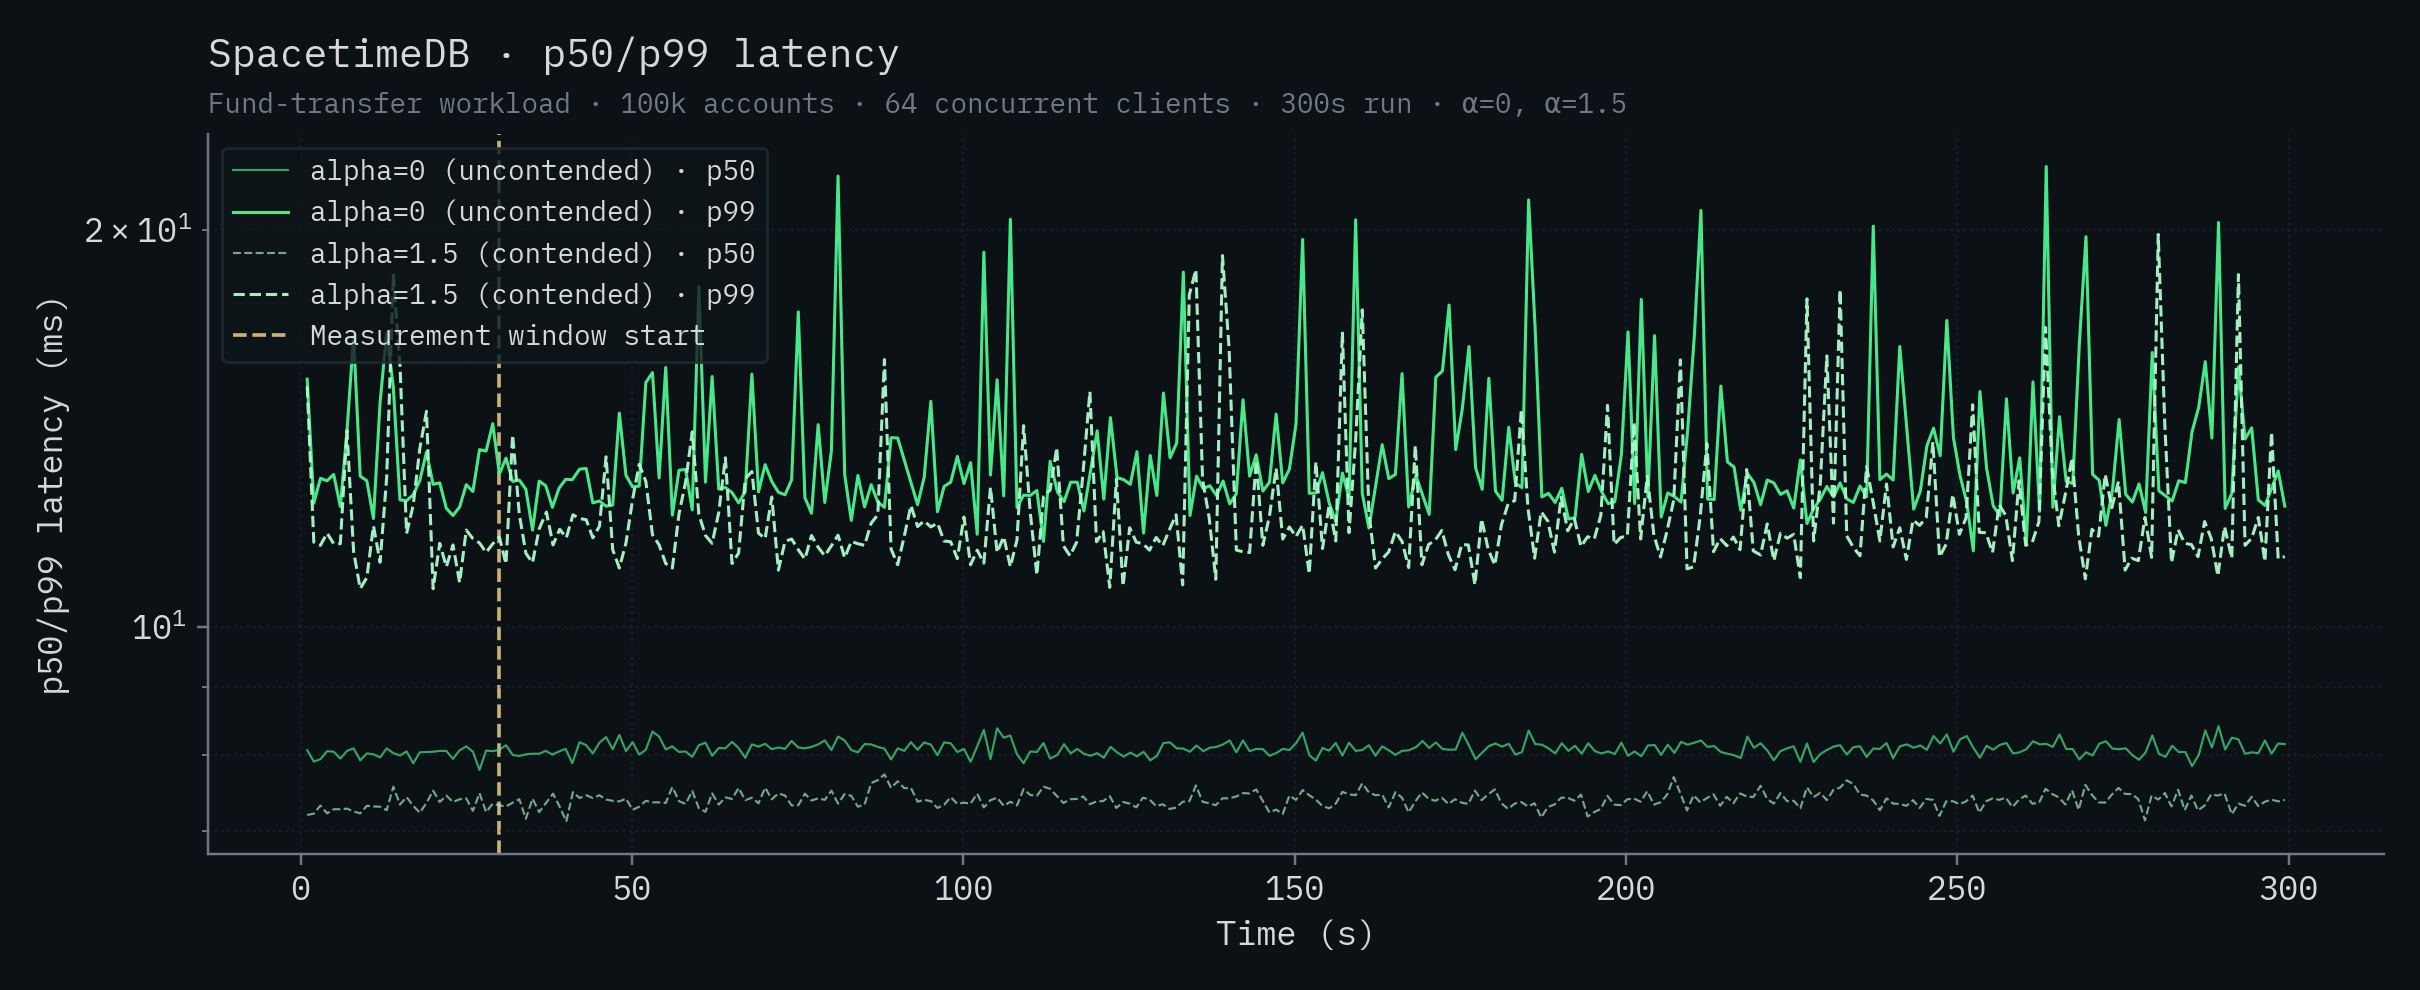
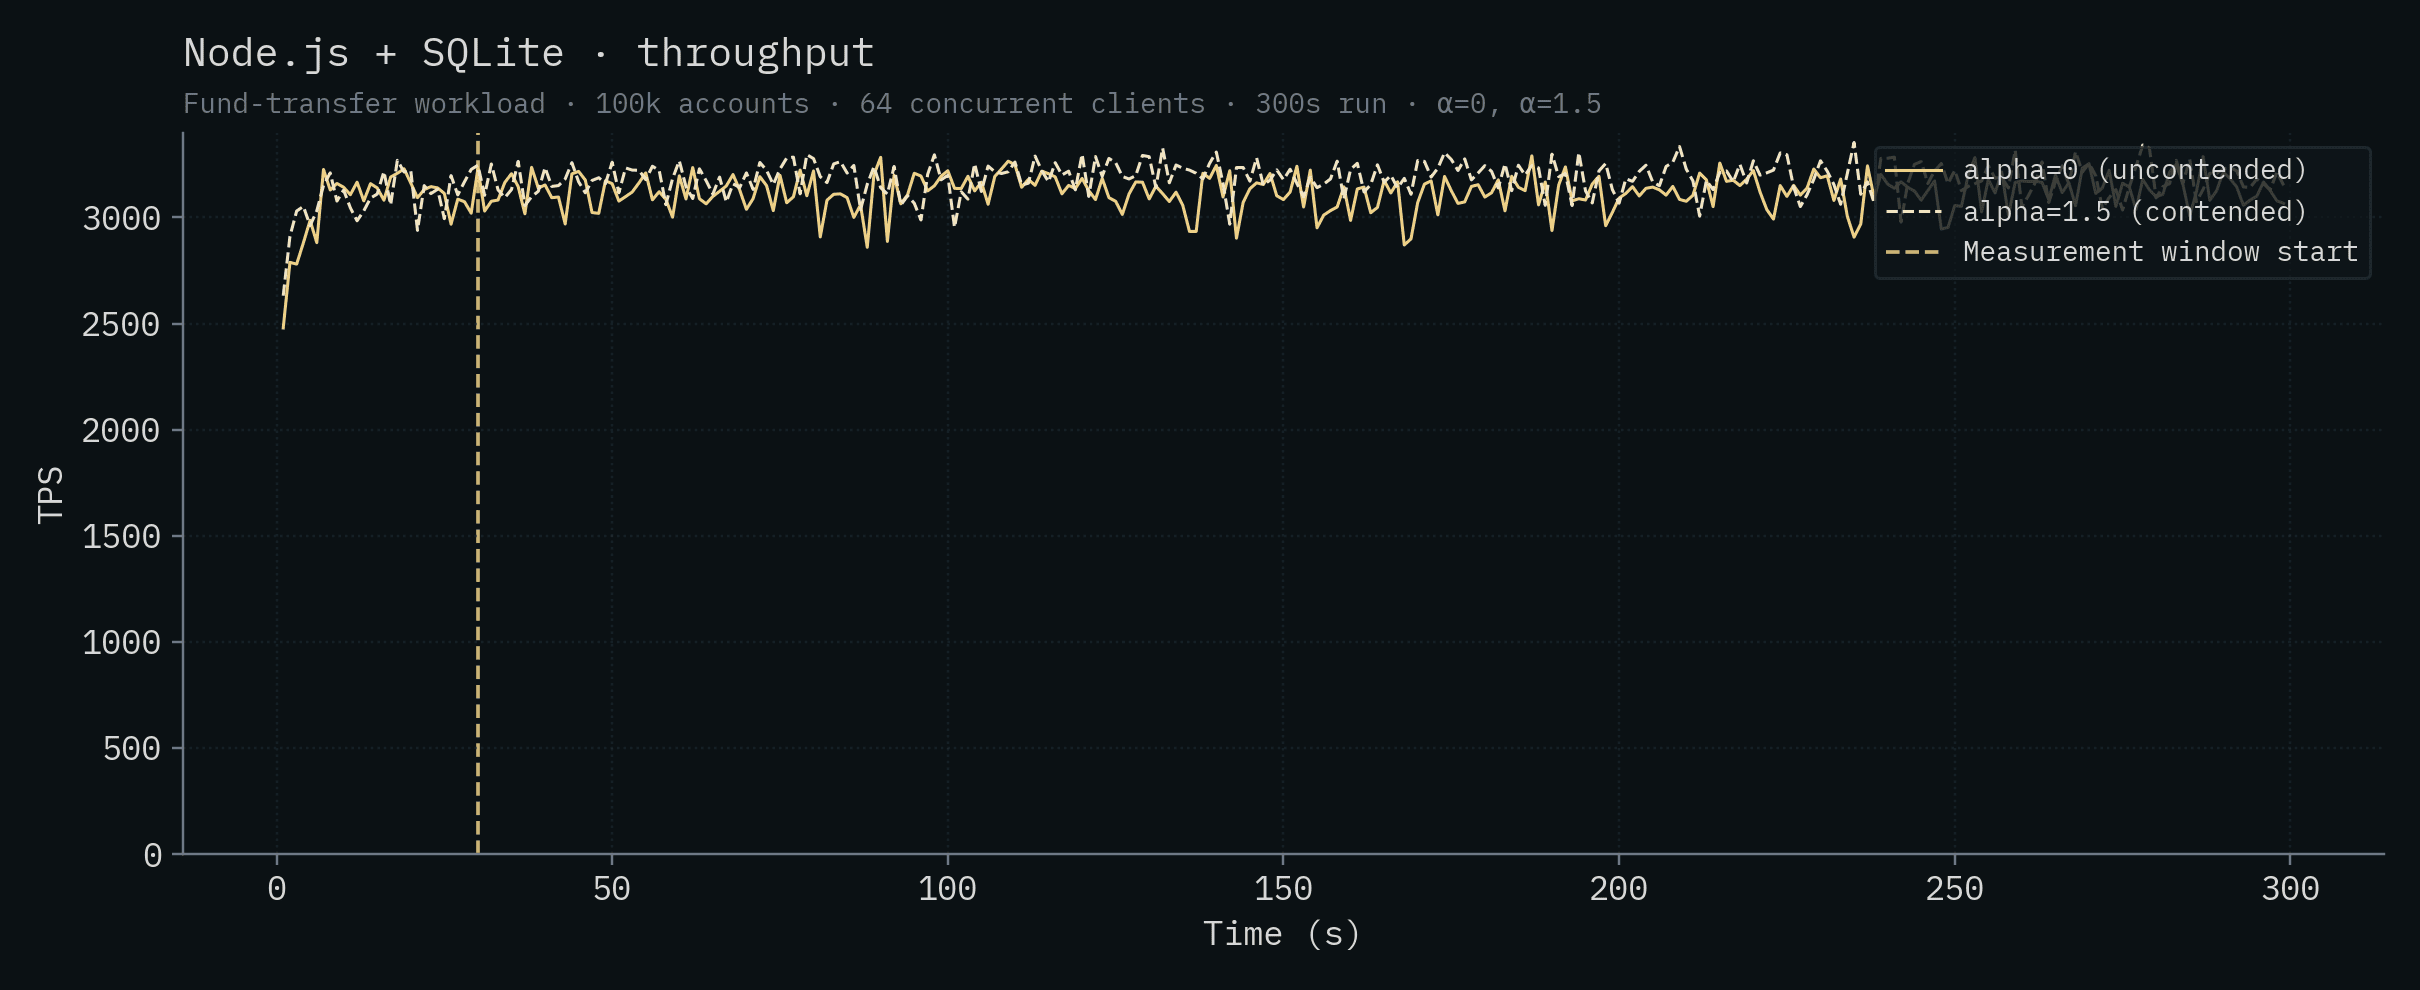
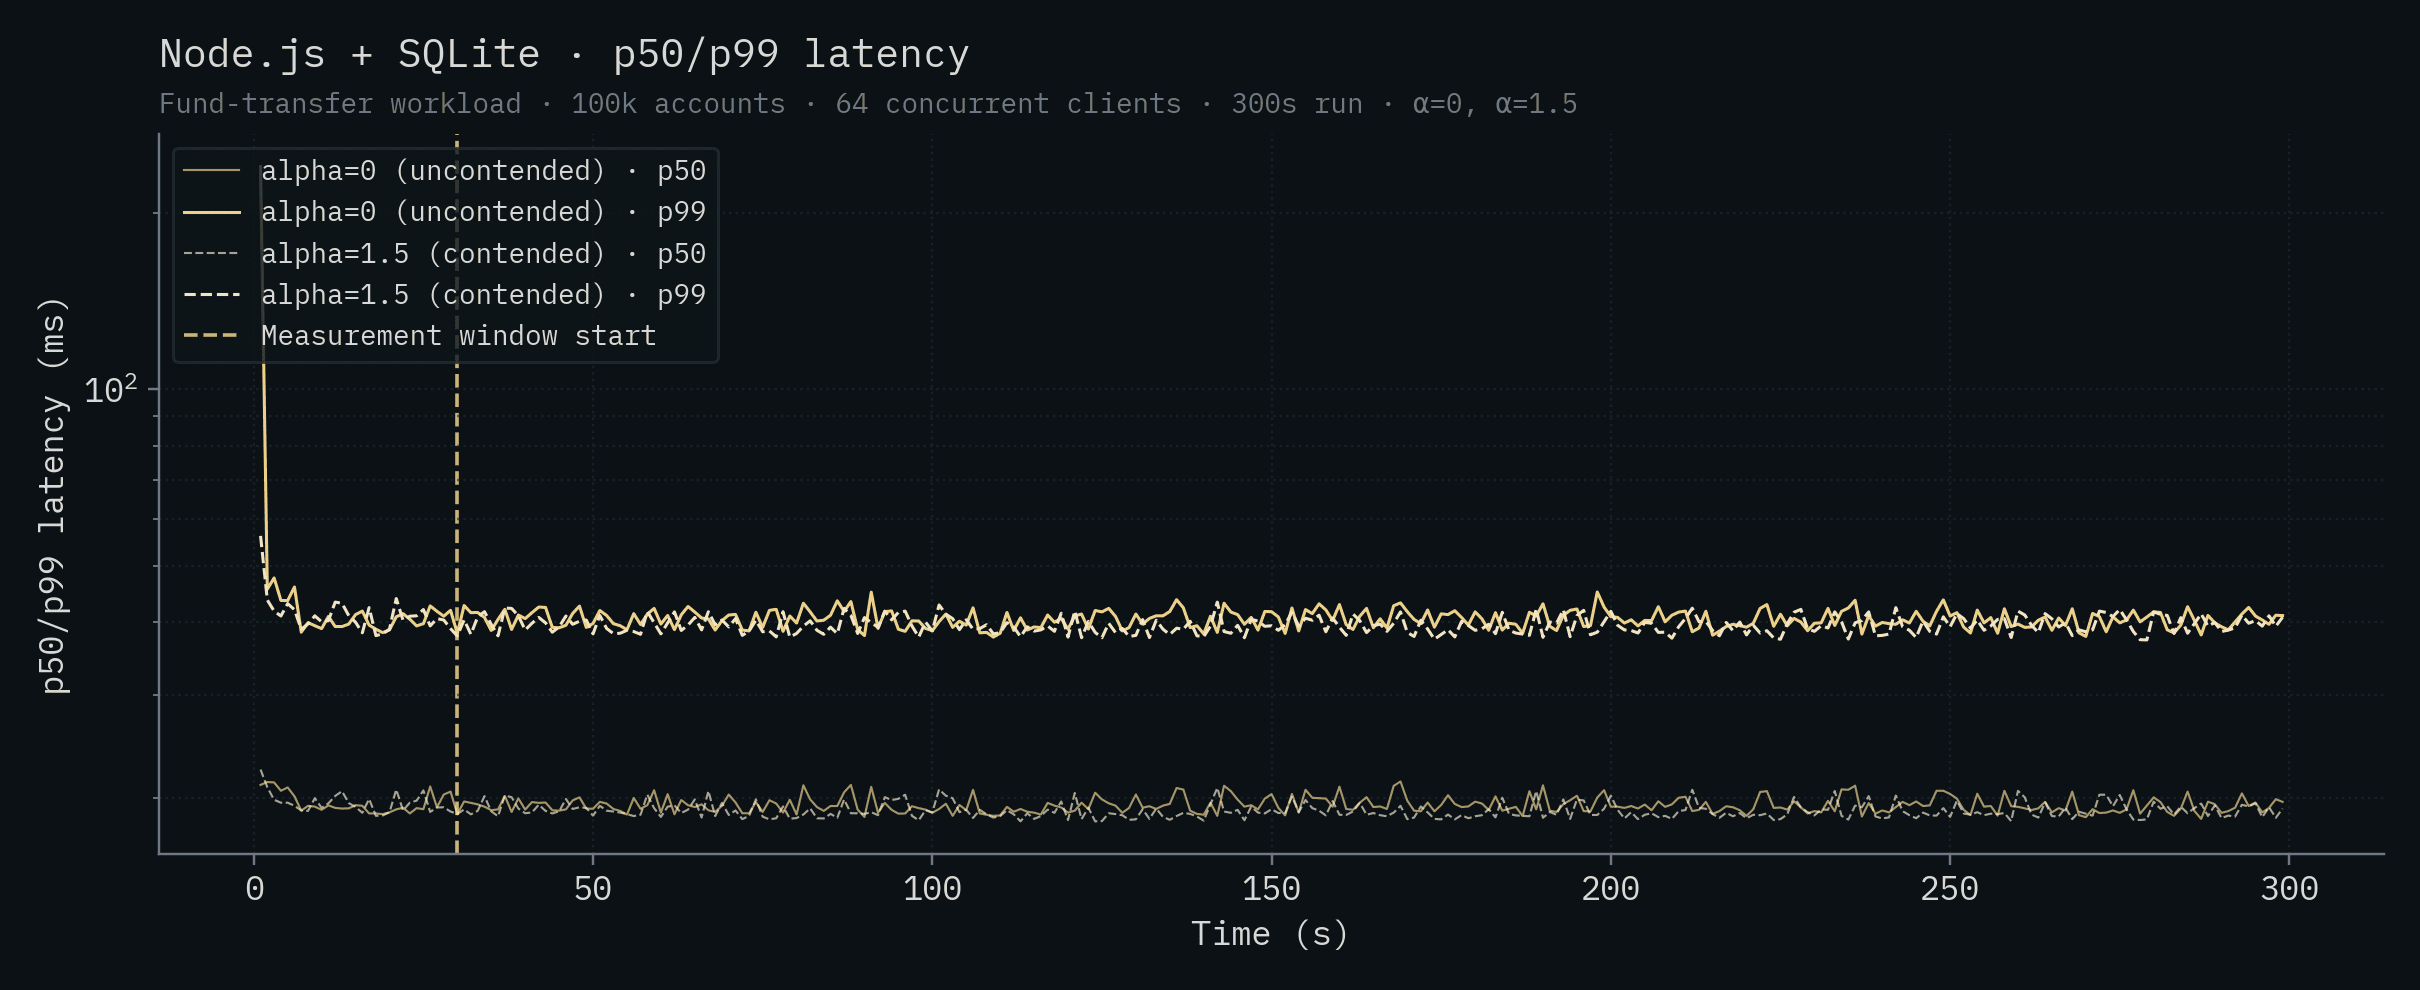
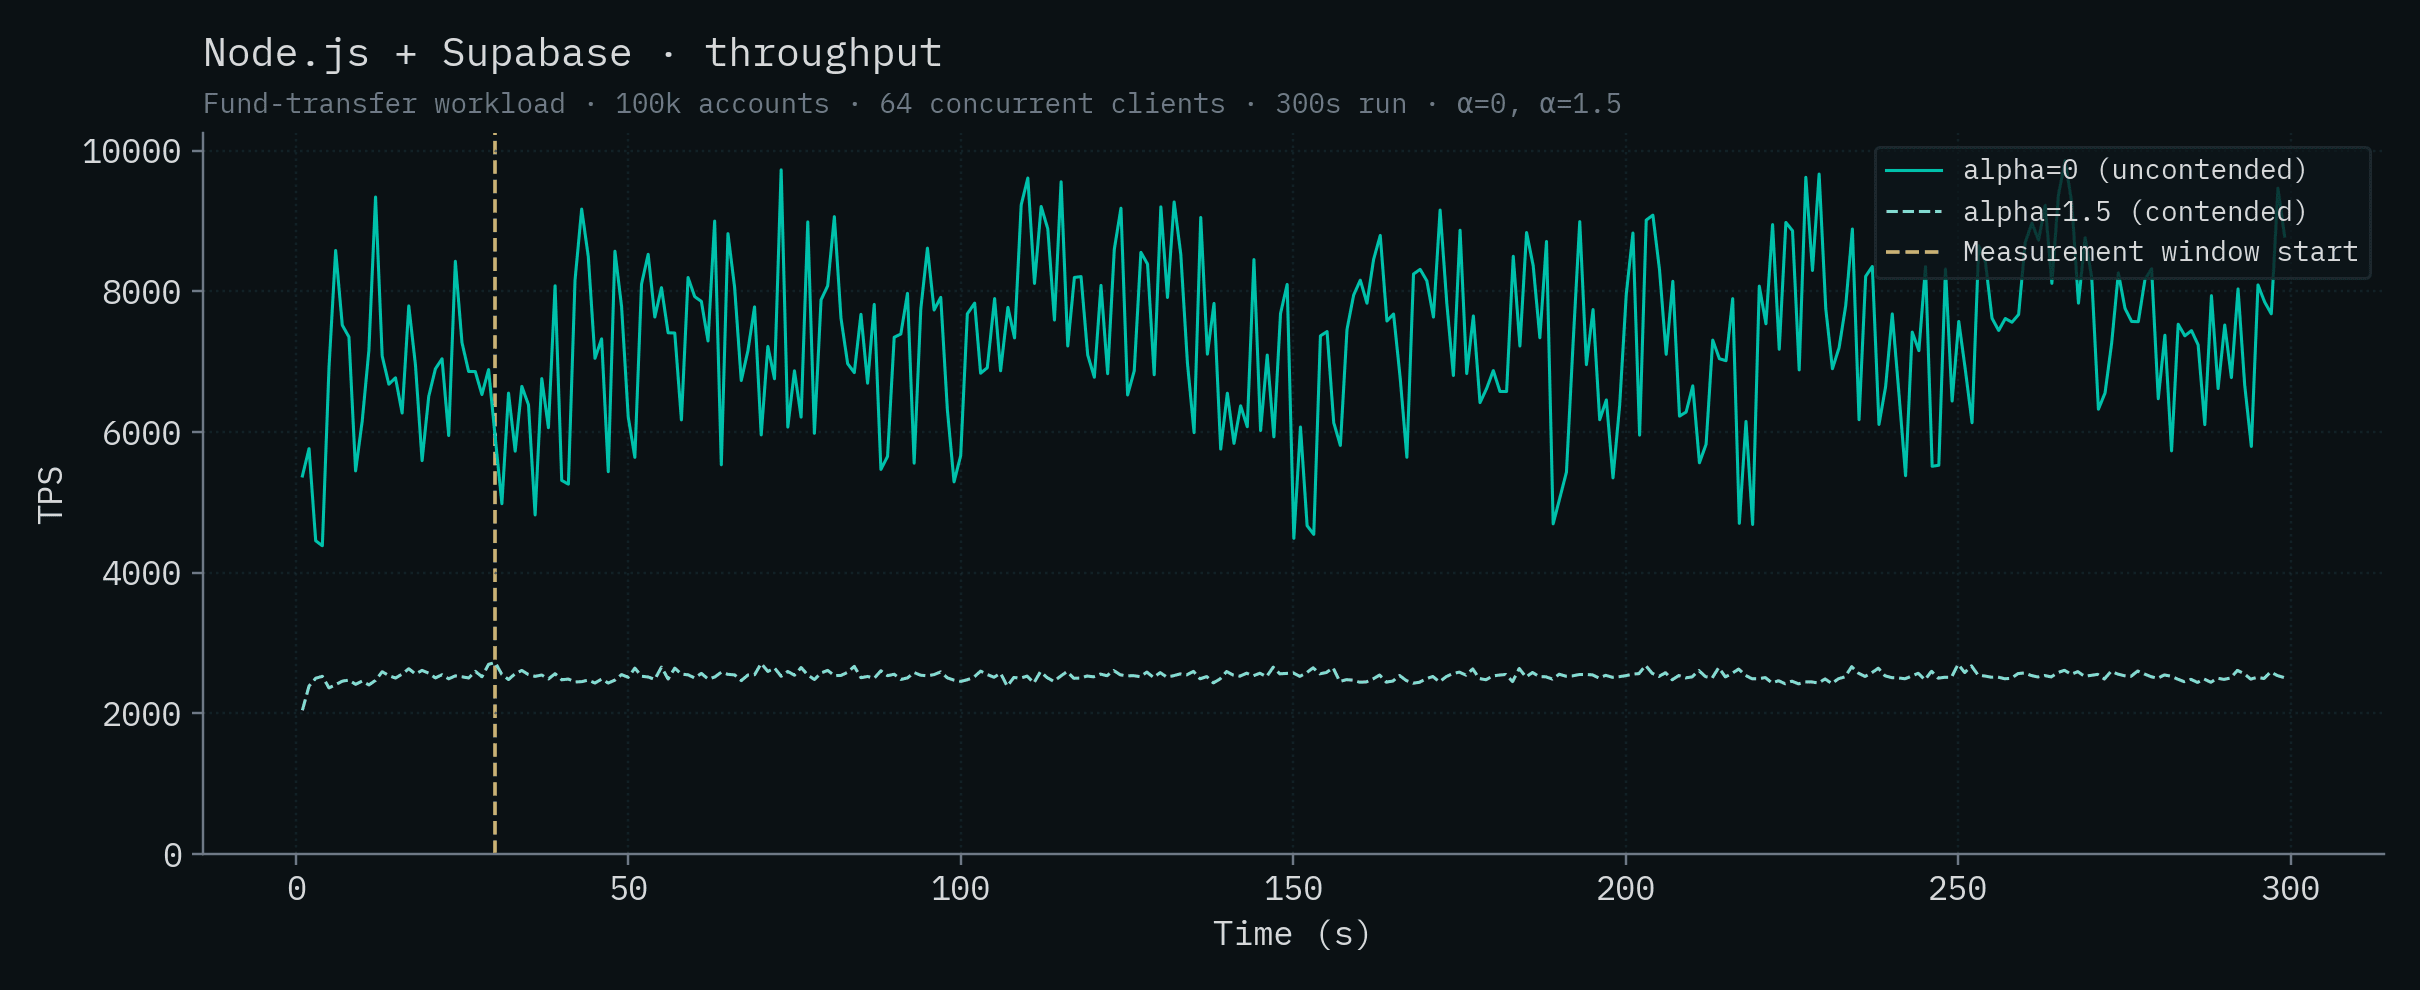
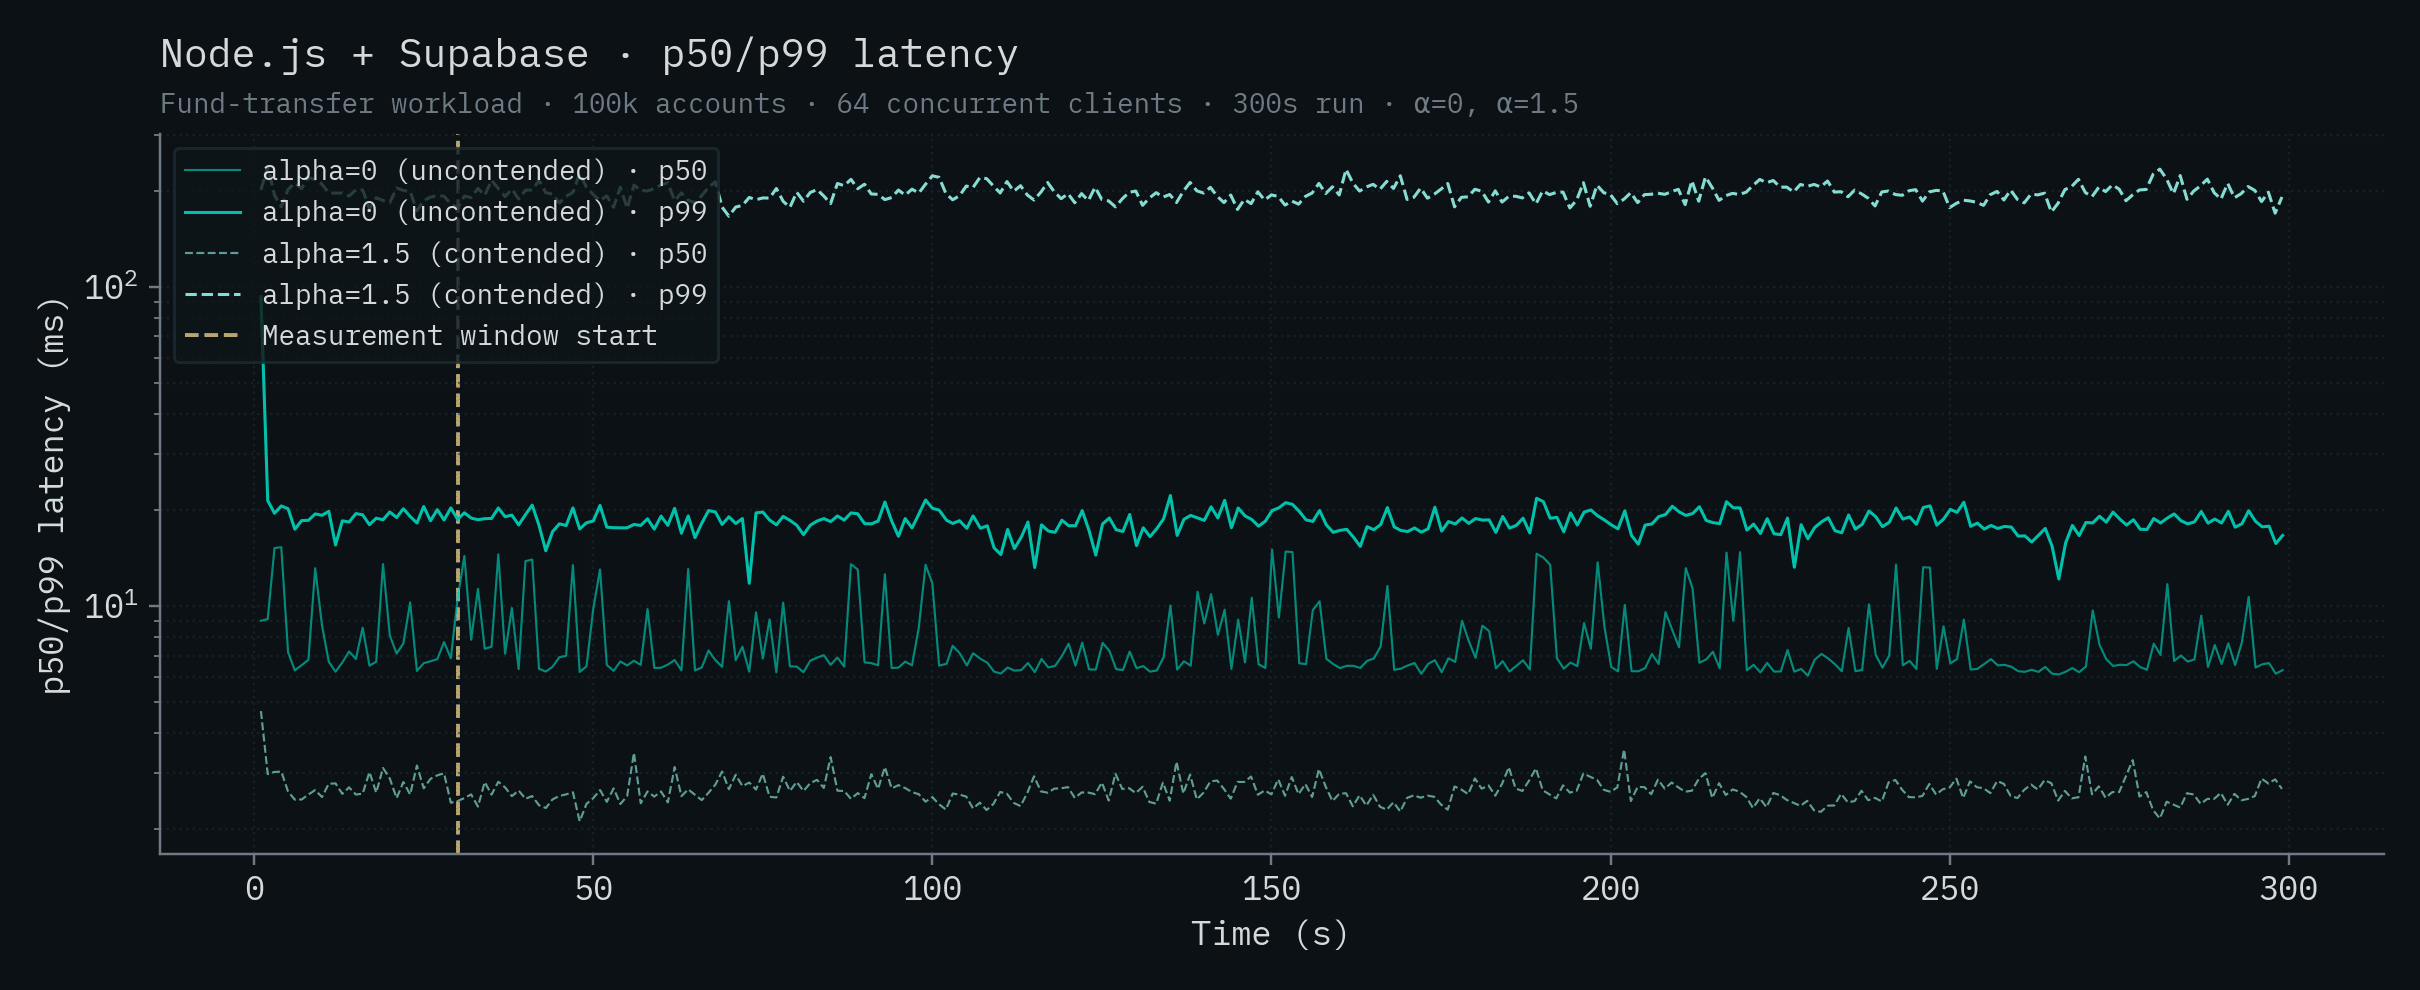
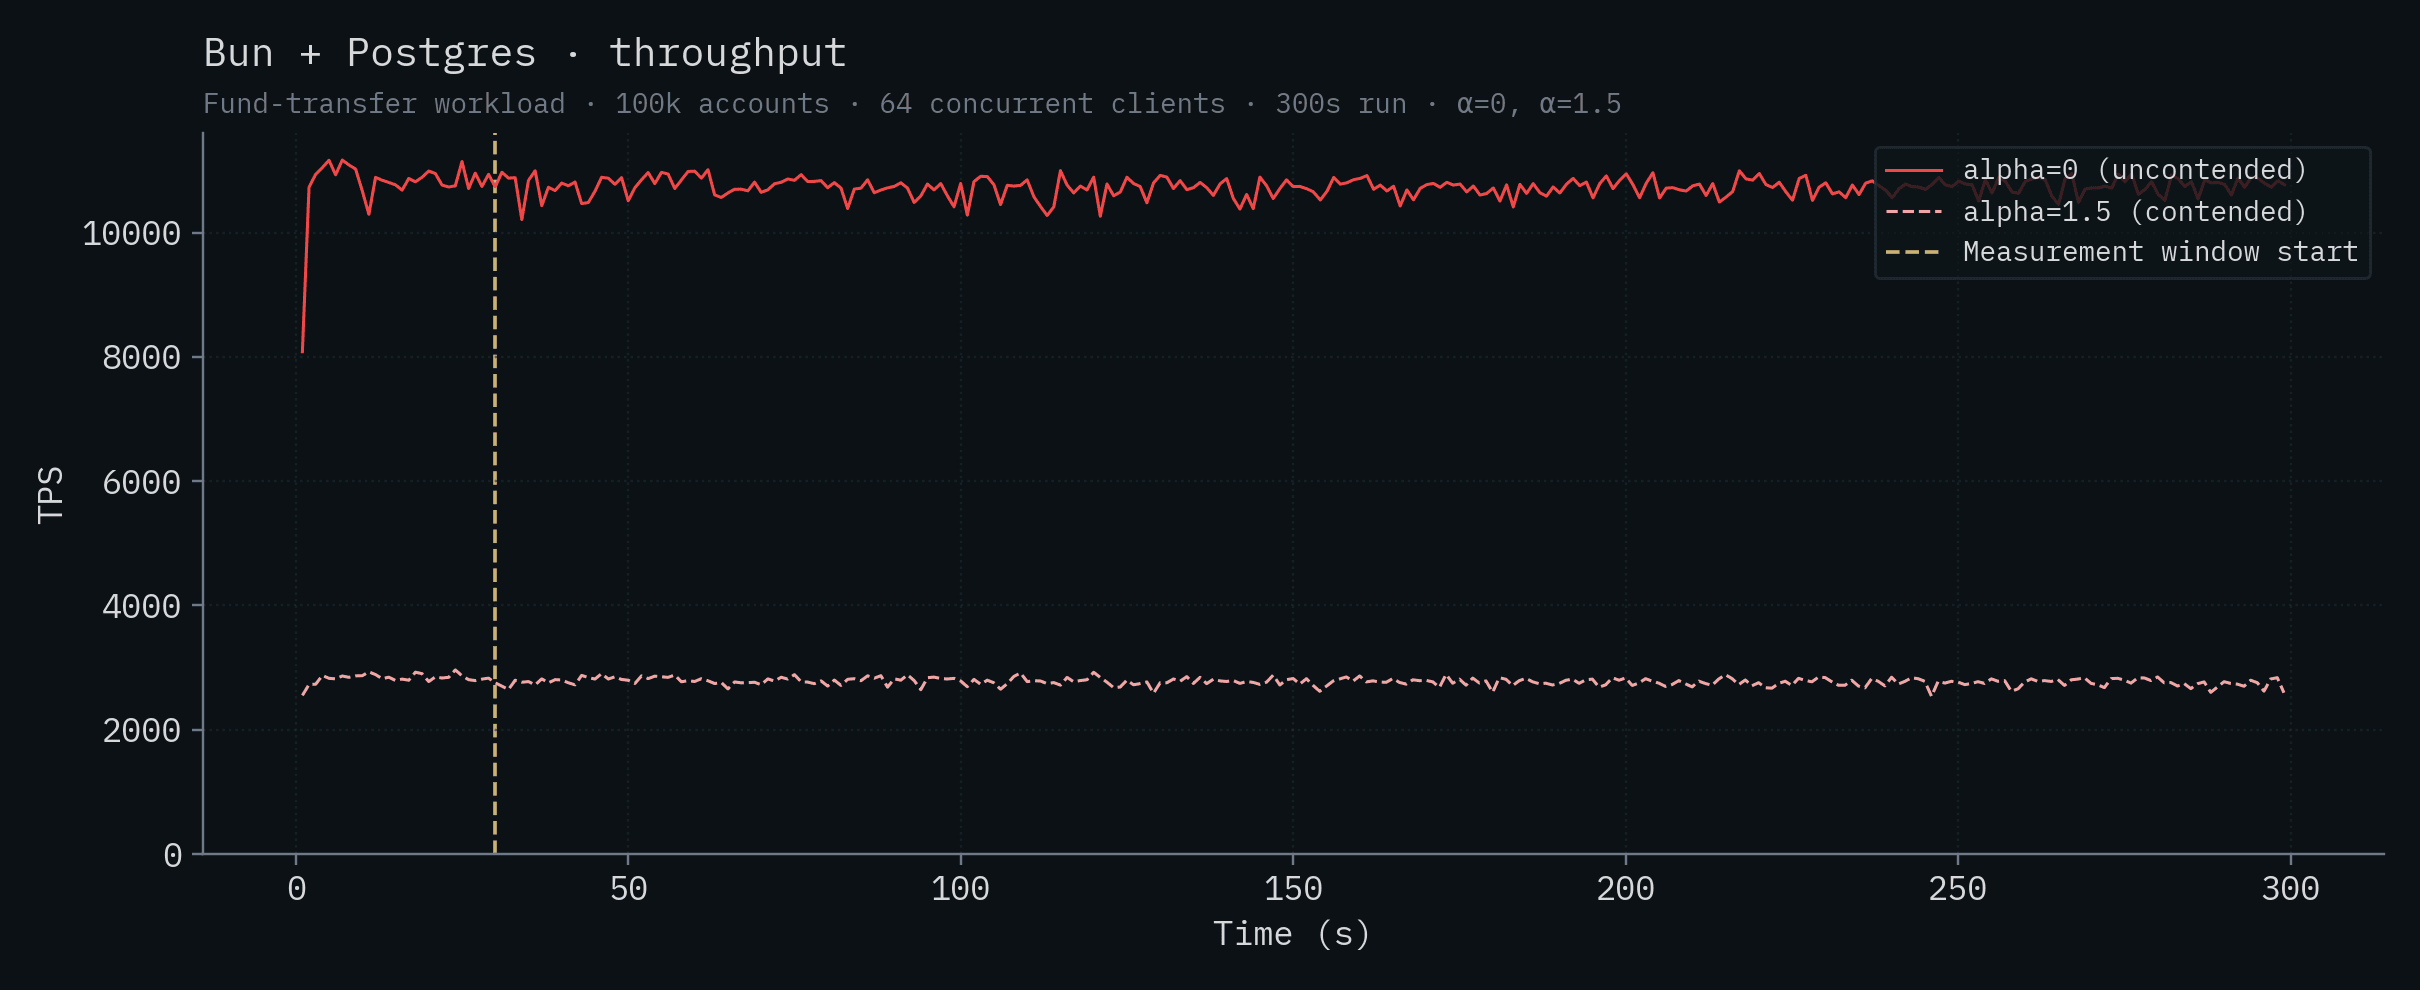
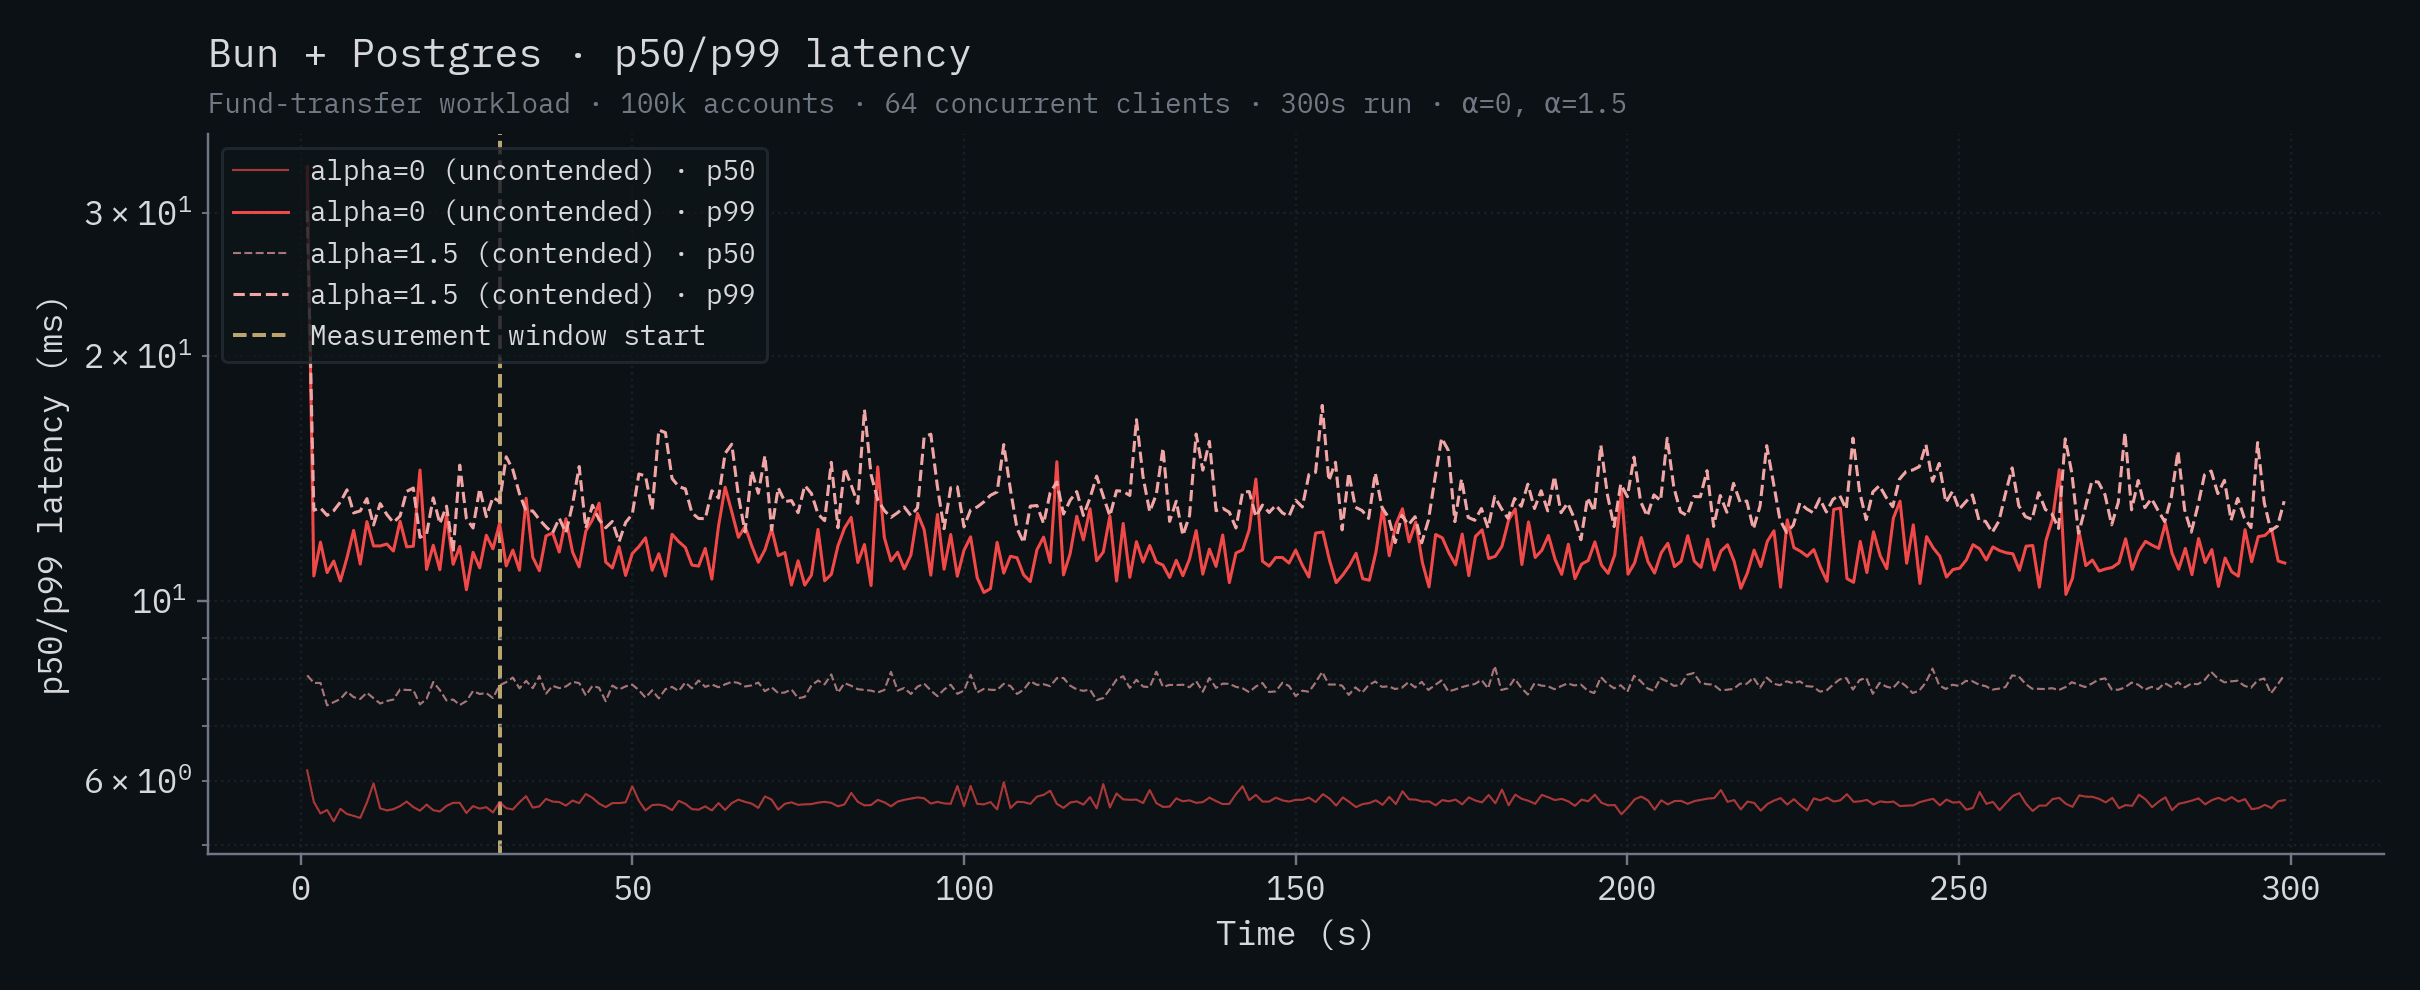
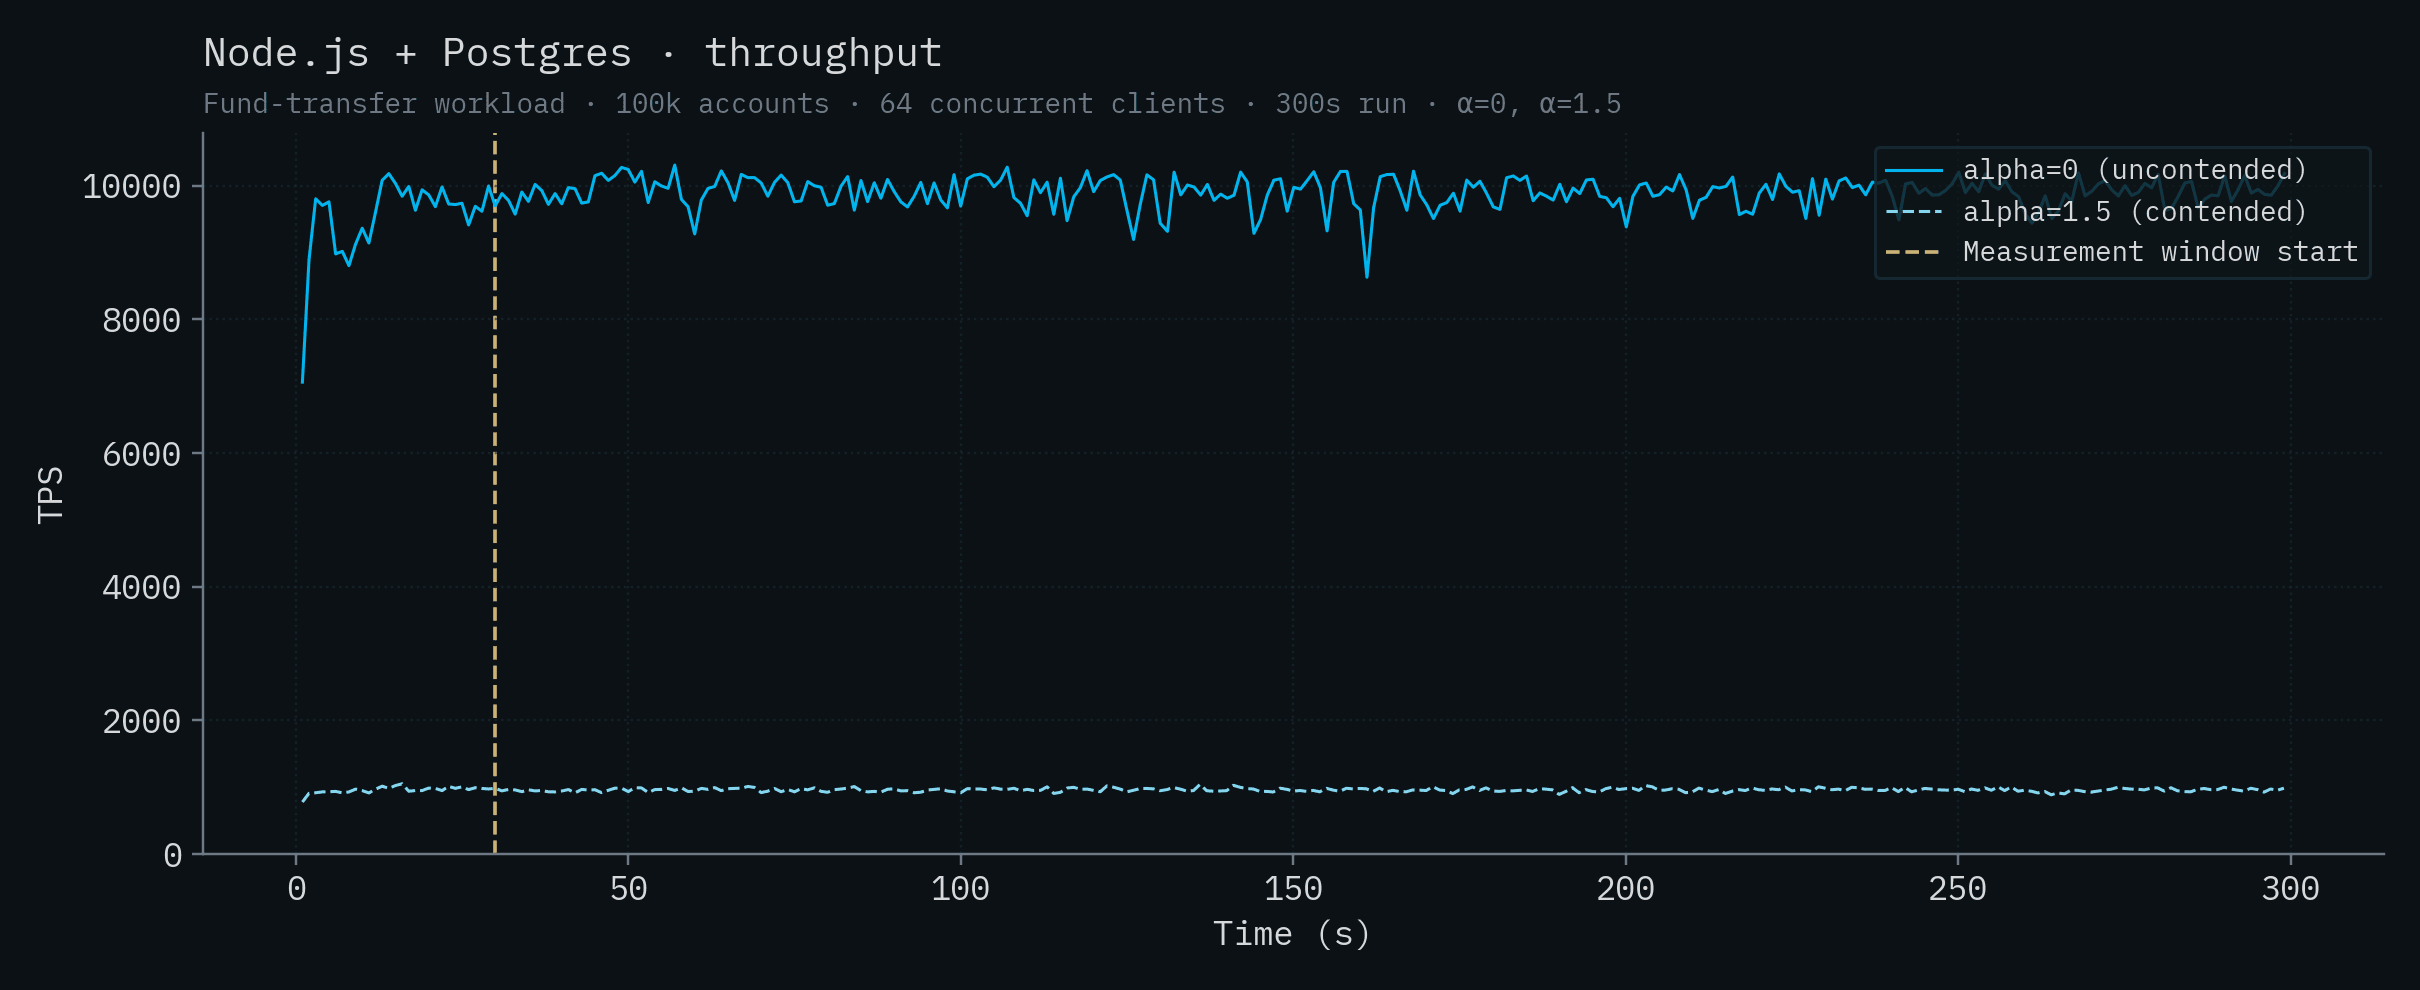
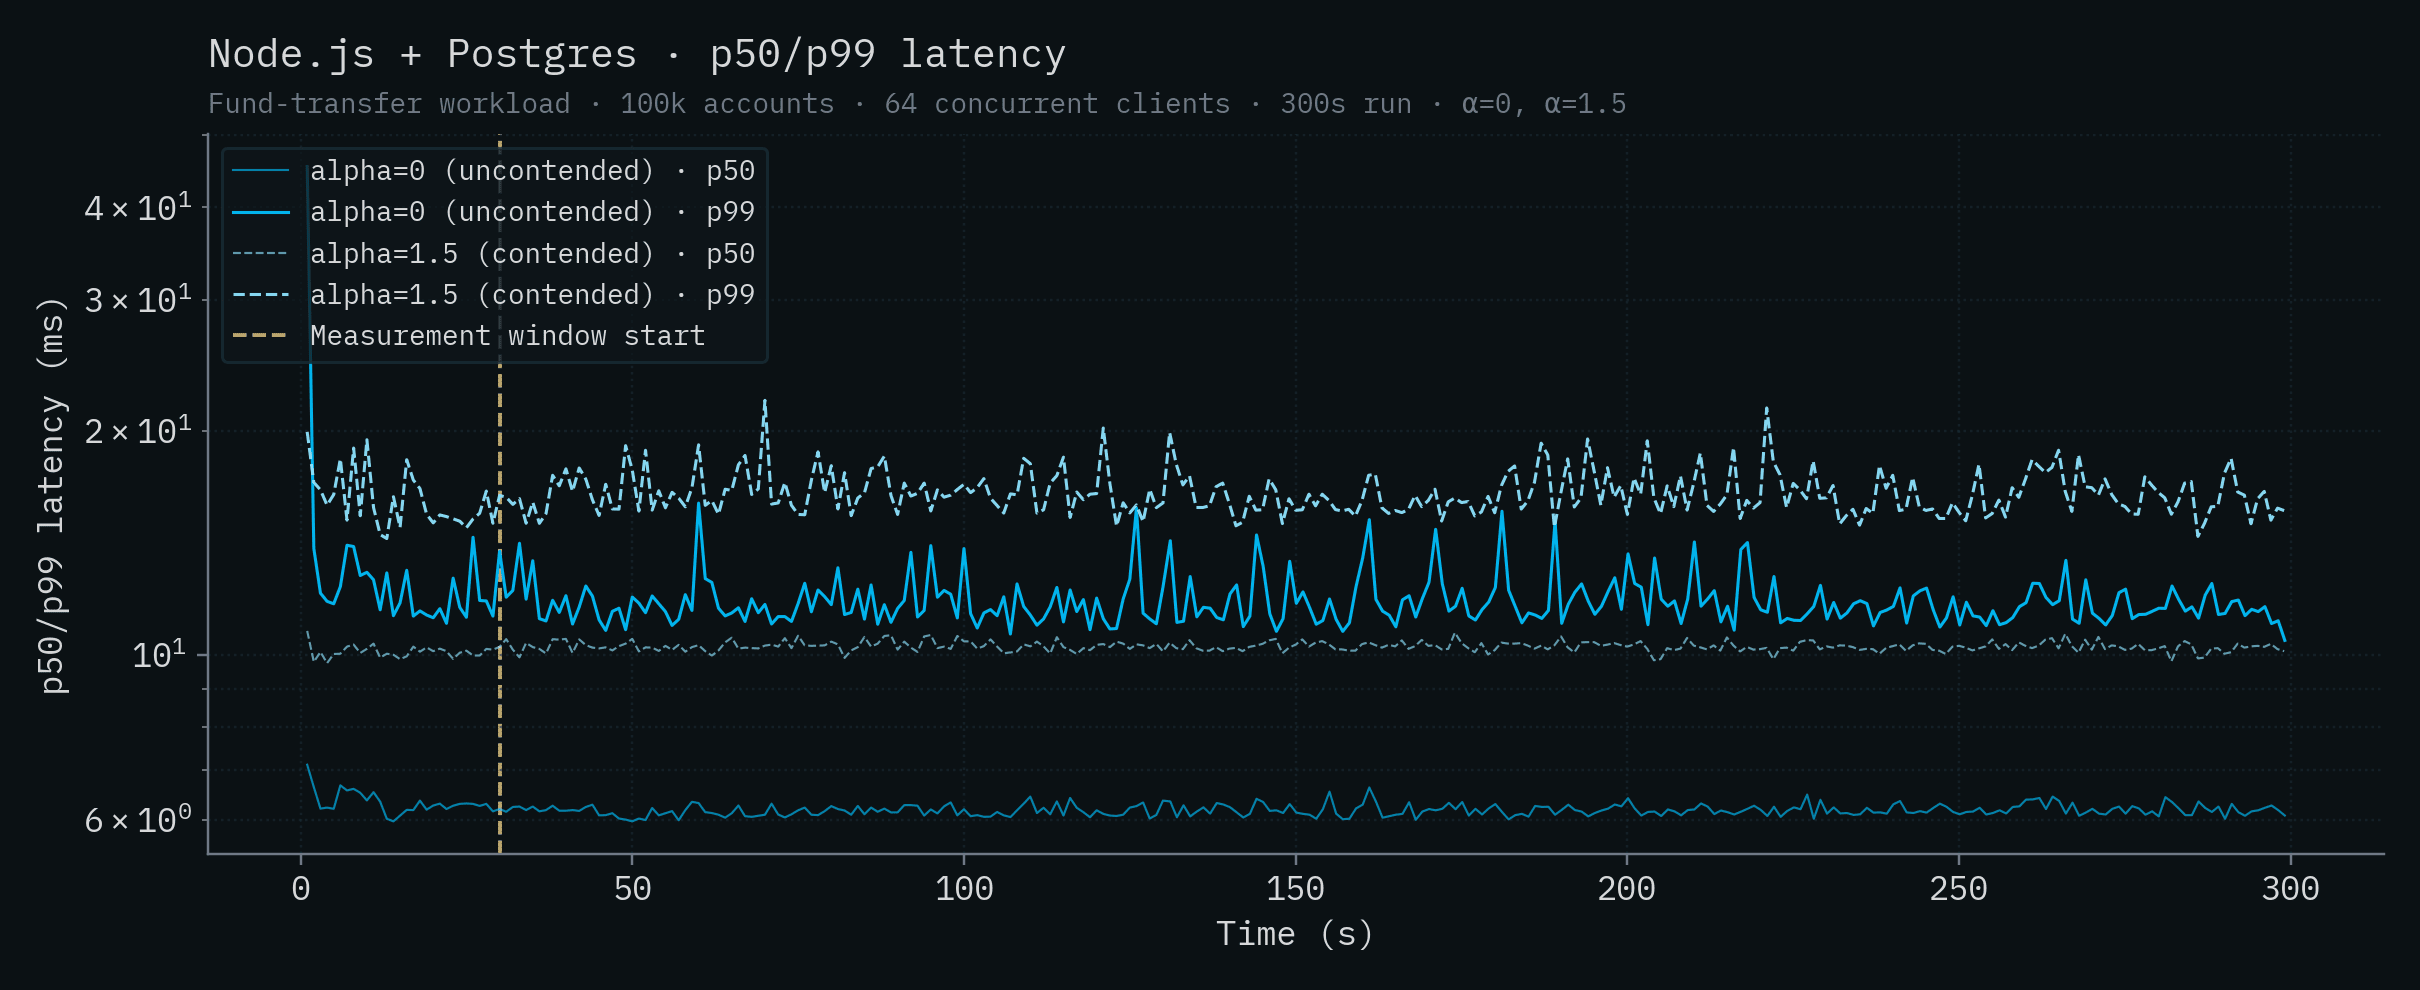
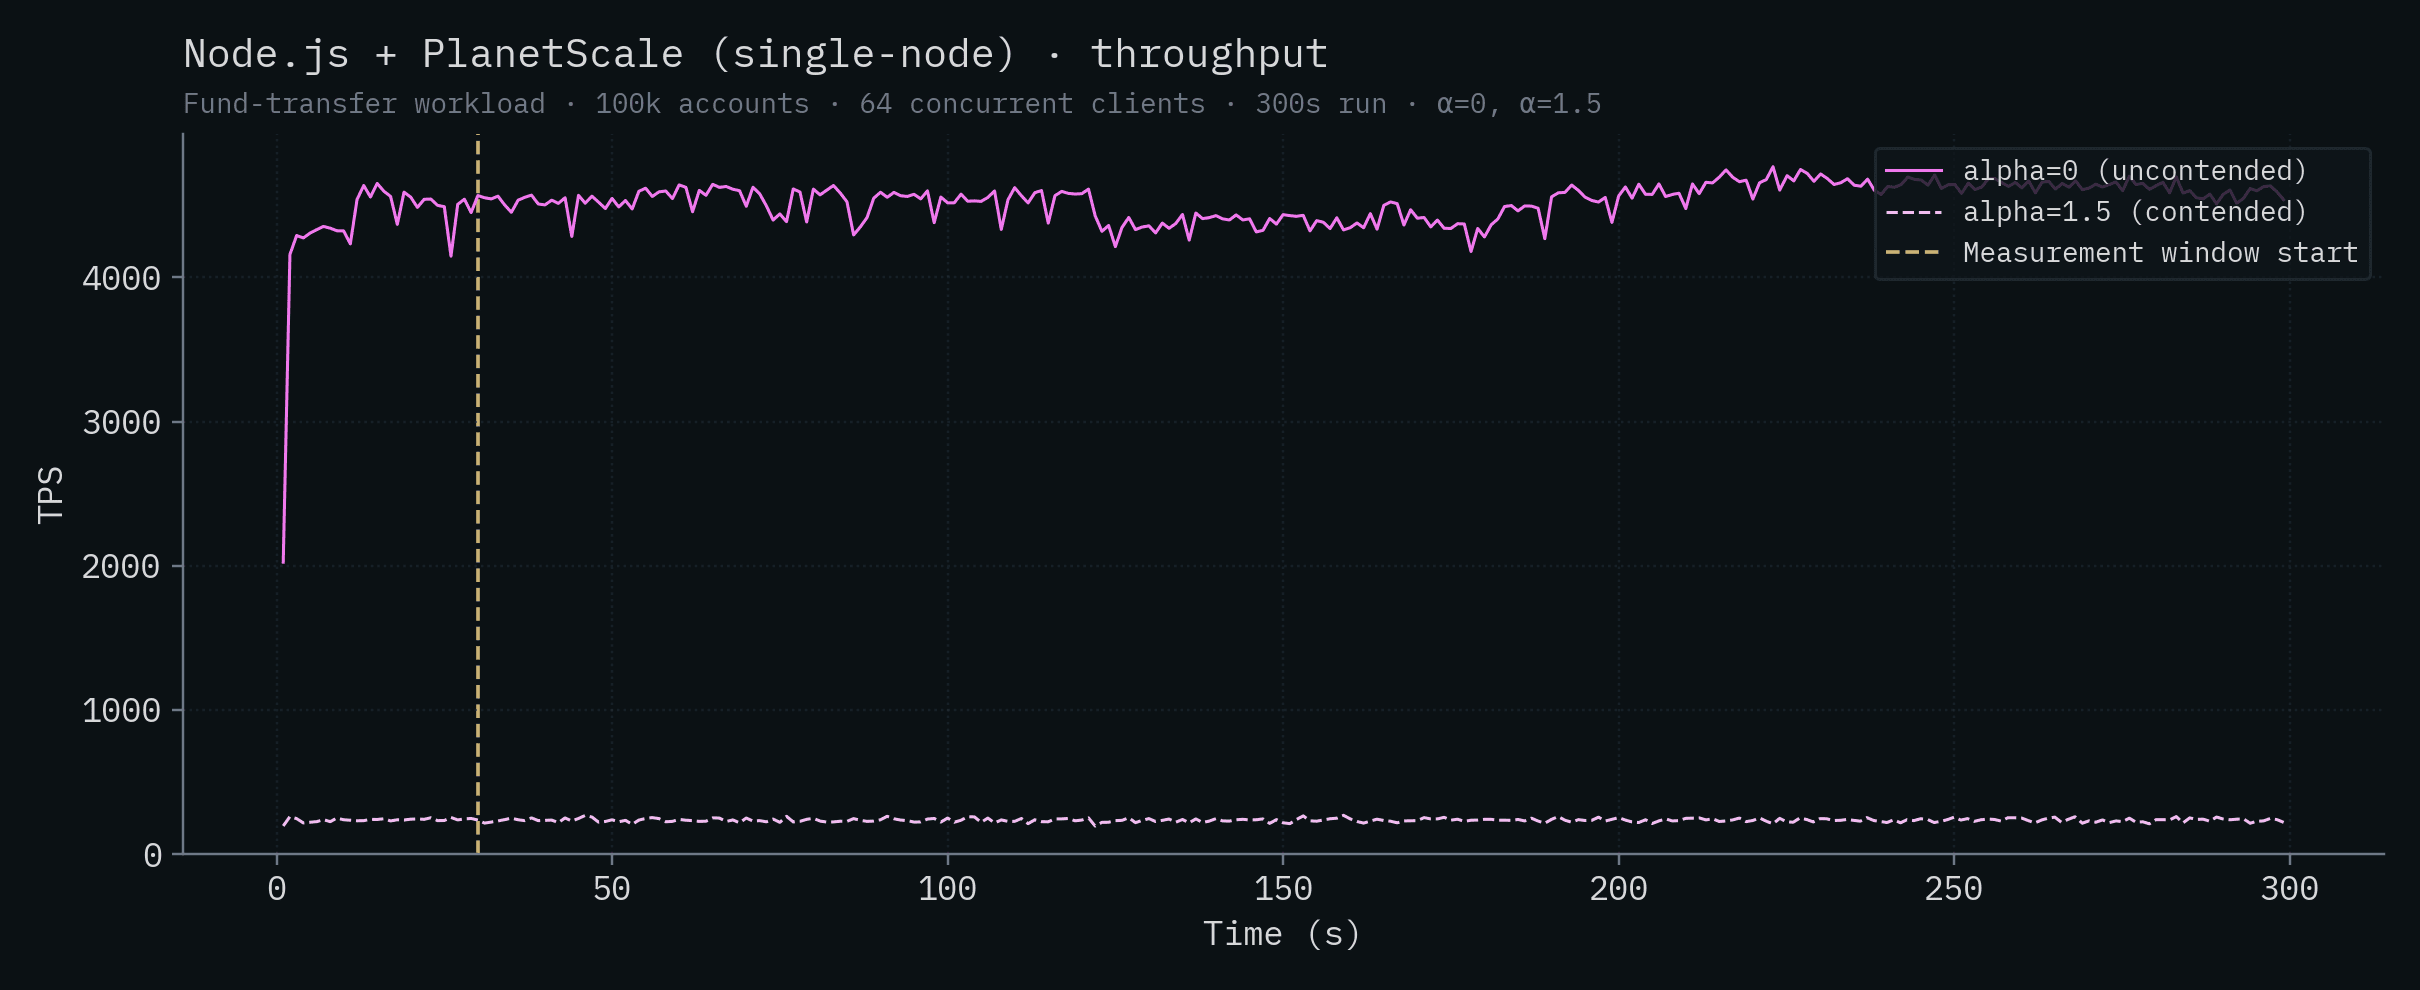
Each chart below shows a single backend's throughput and p50/p99 latency over time. Both α values are overlaid on the same chart: the saturated solid line is α=0 (uncontended), the lighter dashed line is α=1.5 (contended). The vertical yellow line marks the start of the measurement window (t=30s).
SpacetimeDB
These are the same runs that drive the headline numbers earlier in the post: 279,025 ± 4,763 TPS at α=0 and 303,920 ± 4,712 TPS at α=1.5. Differences of a few percent across runs are typical for this benchmark and well within the run-to-run variance you'd expect for the workload.
Node.js + SQLite
Node.js + Supabase
Bun + Postgres
Node.js + Postgres
Node.js + PlanetScale (SN)
Node.js + PlanetScale (HA)
Convex
Node.js + CockroachDB